EXHIBIT 99.1
Published on February 21, 2019
Exhibit 99.1 INVESTOR PRESENTATION February 2019
Forward-Looking Statements This presentation has been prepared by NeoGenomics, Inc. (“we,” ”us,” “our,” “NeoGenomics” or the “Company”) and is made for informational purposes only and does not constitute an offer to sell or a solicitation of an offer to buy securities, nor shall there be any sale of any securities in any state or jurisdiction in which such offer, solicitation or sale would be unlawful prior to registration or qualification under the securities laws of any such state or jurisdiction. The information set forth herein does not purport to be complete or to contain all of the information you may desire. Statements contained herein are made as of the date of this presentation unless stated otherwise, and neither this presentation, nor any sale of securities, shall under any circumstances create an implication that the information contained herein is correct as of any time after such date or that information will be updated or revised to reflect information that subsequently becomes available or changes occurring after the date hereof. This presentation contains “forward-looking statements” within the meaning of the Private Securities Litigation Reform Act of 1995 relating to business, operations, and financial conditions of the Company. Words such as, but not limited to, “look forward to,” “believe,” “expect,” “anticipate,” “estimate,” “intend,” “plan,” “would,” “should” and “could,” and similar expressions or words, identify forward-looking statements. Although the Company believes the expectations reflected in such forward-looking statements are based upon reasonable assumptions, there can be no assurance that its expectations will be realized. Actual results could differ materially from those projected in the Company’s forward-looking statements due to numerous known and unknown risks and uncertainties. All forward-looking statements speak only as of the date of this presentation and are qualified in their entirety by this cautionary statement. The Company undertakes no obligation to revise or update this presentation to reflect events or circumstances after the date hereof. Non-GAAP Adjusted EBITDA "Adjusted EBITDA" is defined by NeoGenomics as net income from continuing operations before: (i) interest expense, (ii) tax expense, (iii) depreciation and amortization expense, non-cash stock-based compensation expense, and if applicable in a reporting period, acquisition-related transaction expenses (vi) non-cash impairments of intangible assets (vii) debt financing costs (viii) and other significant non-recurring or non-operating (income) or expenses. 2
Investment Highlights Leading publicly-traded, comprehensive, pure-play oncology testing company in the U.S. Substantial Oncology/Genetics Market tailwinds Significant near-term growth drivers Market share gains driven by customer satisfaction Rapidly growing Pharma Services business Track record of profitable growth and cash flow 3
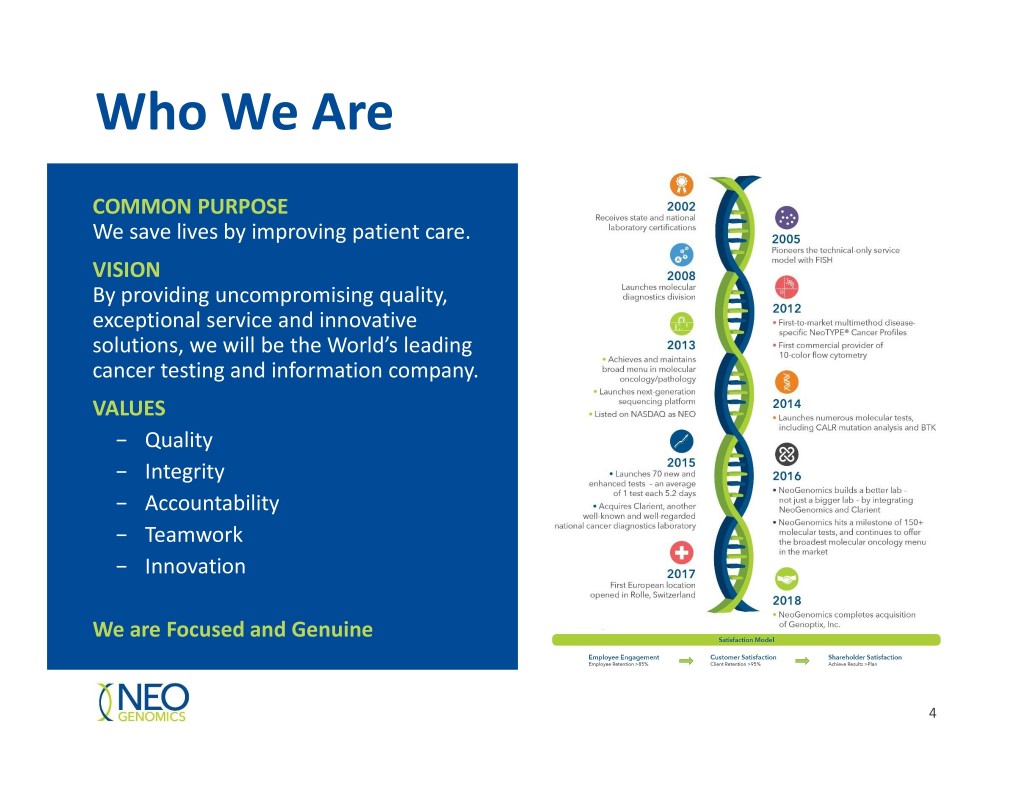
Who We Are COMMON PURPOSE We save lives by improving patient care. VISION By providing uncompromising quality, exceptional service and innovative solutions, we will be the World’s leading cancer testing and information company. VALUES − Quality − Integrity − Accountability − Teamwork − Innovation We are Focused and Genuine 4
Company Overview Comprehensive, oncology-focused test menu • Extensive molecular-oncology offering, with 150+ tests • A leader in immuno-oncology testing • In-house digital pathology expertise Extensive clinical expertise • ~80 pathologists and PhDs Global Pharma Services offering • $99 million backlog of signed contracts • Labs in US, Europe and Asia Significant scale and scope • 2600+ hospitals and cancer centers • 900,000+ tests per year • Broad geographic coverage with major labs in California, Florida and Texas 5
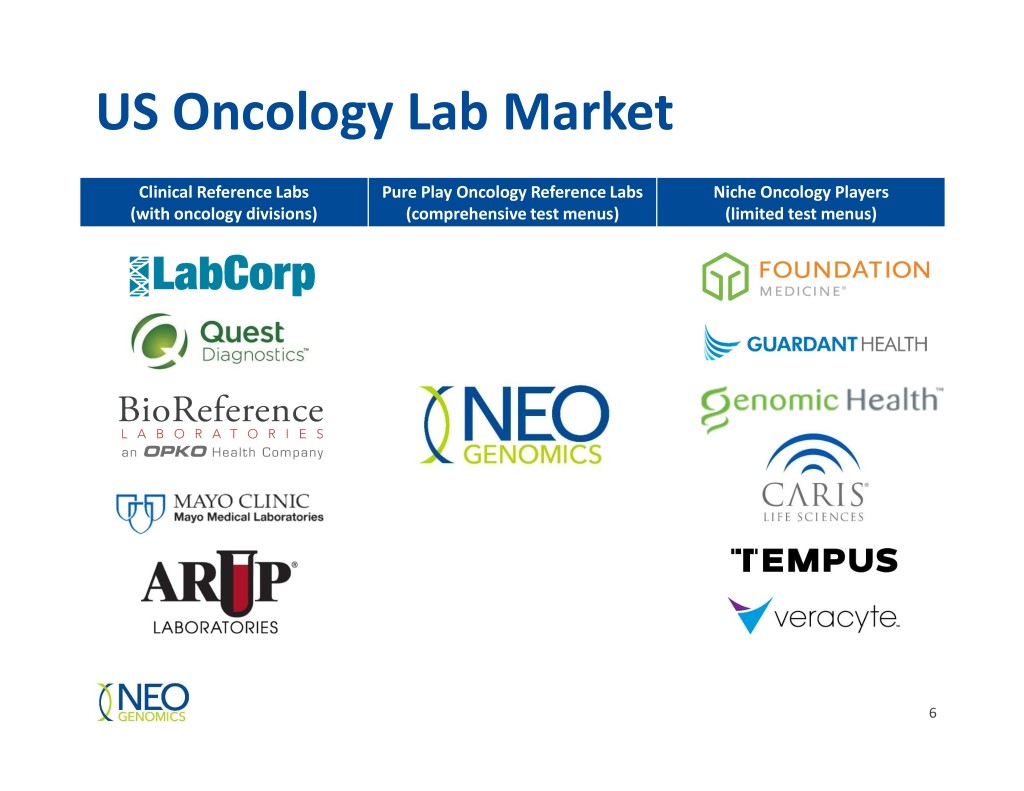
US Oncology Lab Market Clinical Reference Labs Pure Play Oncology Reference Labs Niche Oncology Players (with oncology divisions) (comprehensive test menus) (limited test menus) 6
Our Competitive Advantage • Comprehensive, multi-modality “one-stop-shop” • Large and advanced somatic cancer test menu • Unparalleled reach into all customer segments, including hospitals, pathologists, and community oncology practices • National footprint and extensive payer contracts • Outstanding client service and partnership models • Synergistic Pharma and Clinical businesses 7
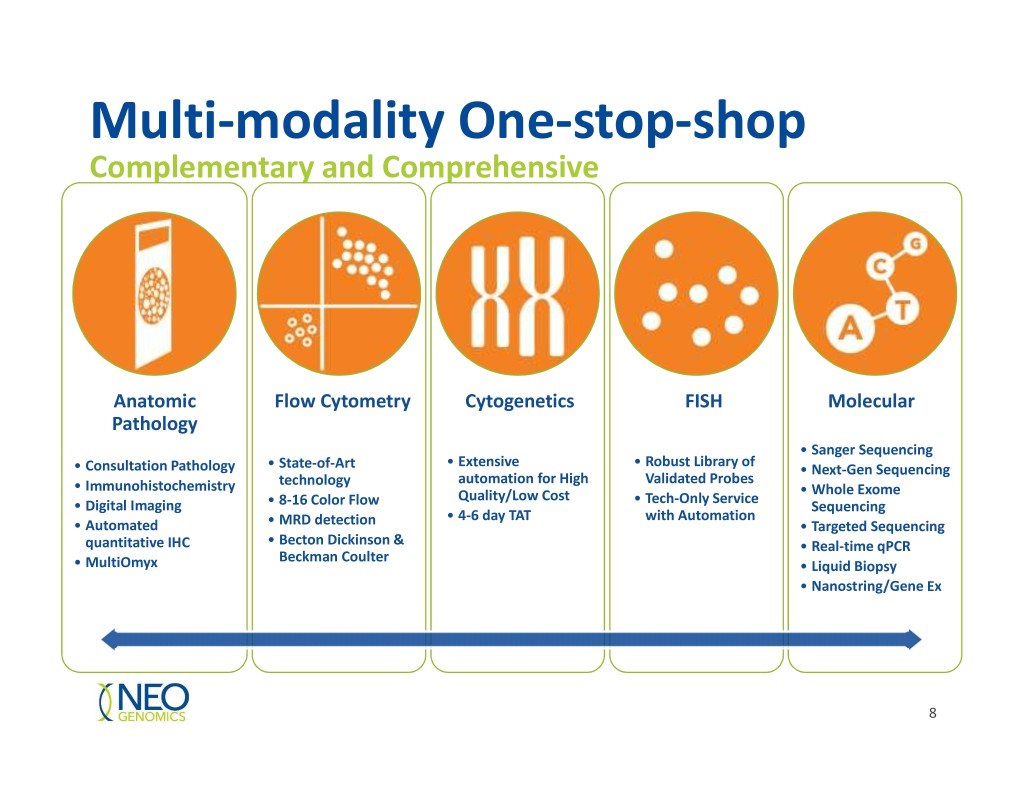
Multi-modality One-stop-shop Complementary and Comprehensive Anatomic Flow Cytometry Cytogenetics FISH Molecular Pathology • Sanger Sequencing • Extensive • Robust Library of • Consultation Pathology • State-of-Art • Next-Gen Sequencing technology automation for High Validated Probes • Immunohistochemistry • Whole Exome Quality/Low Cost • Tech-Only Service • Digital Imaging • 8-16 Color Flow Sequencing • 4-6 day TAT with Automation • Automated • MRD detection • Targeted Sequencing quantitative IHC • Becton Dickinson & • Real-time qPCR Beckman Coulter • MultiOmyx • Liquid Biopsy • Nanostring/Gene Ex 8
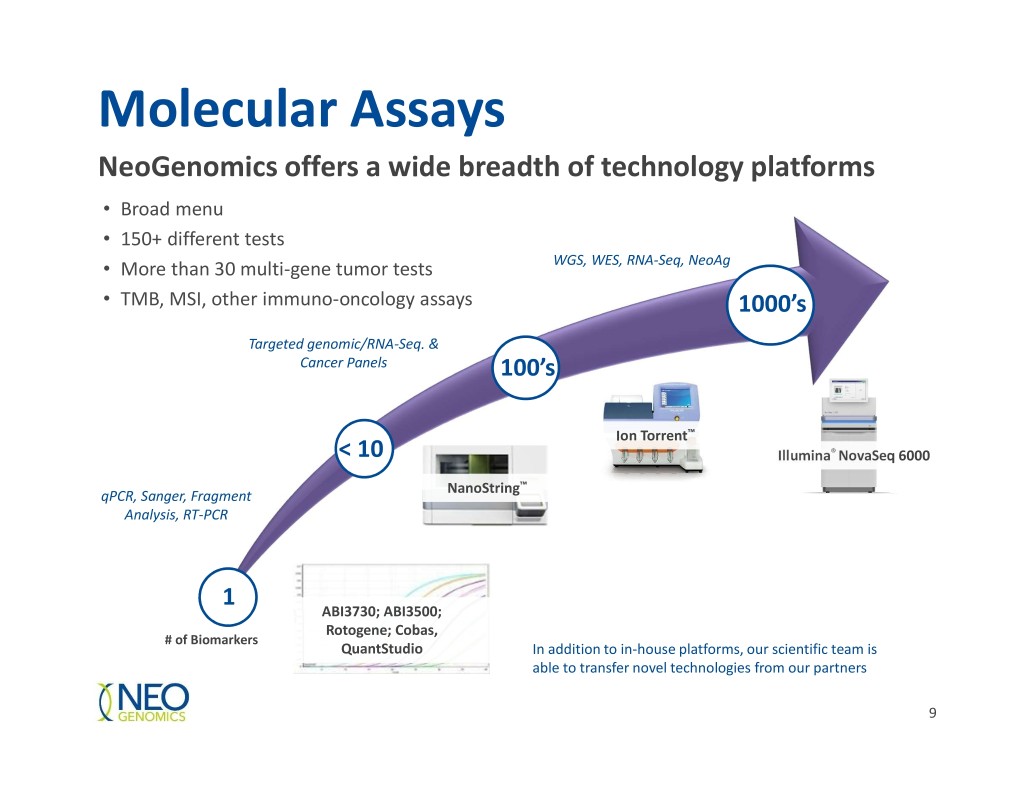
Molecular Assays NeoGenomics offers a wide breadth of technology platforms • Broad menu • 150+ different tests • More than 30 multi-gene tumor tests WGS, WES, RNA-Seq, NeoAg • TMB, MSI, other immuno-oncology assays 1000’s Targeted genomic/RNA-Seq. & Cancer Panels 100’s Ion Torrent™ < 10 Illumina® NovaSeq 6000 NanoString™ qPCR, Sanger, Fragment Analysis, RT-PCR 1 ABI3730; ABI3500; Rotogene; Cobas, # of Biomarkers QuantStudio In addition to in-house platforms, our scientific team is able to transfer novel technologies from our partners 9
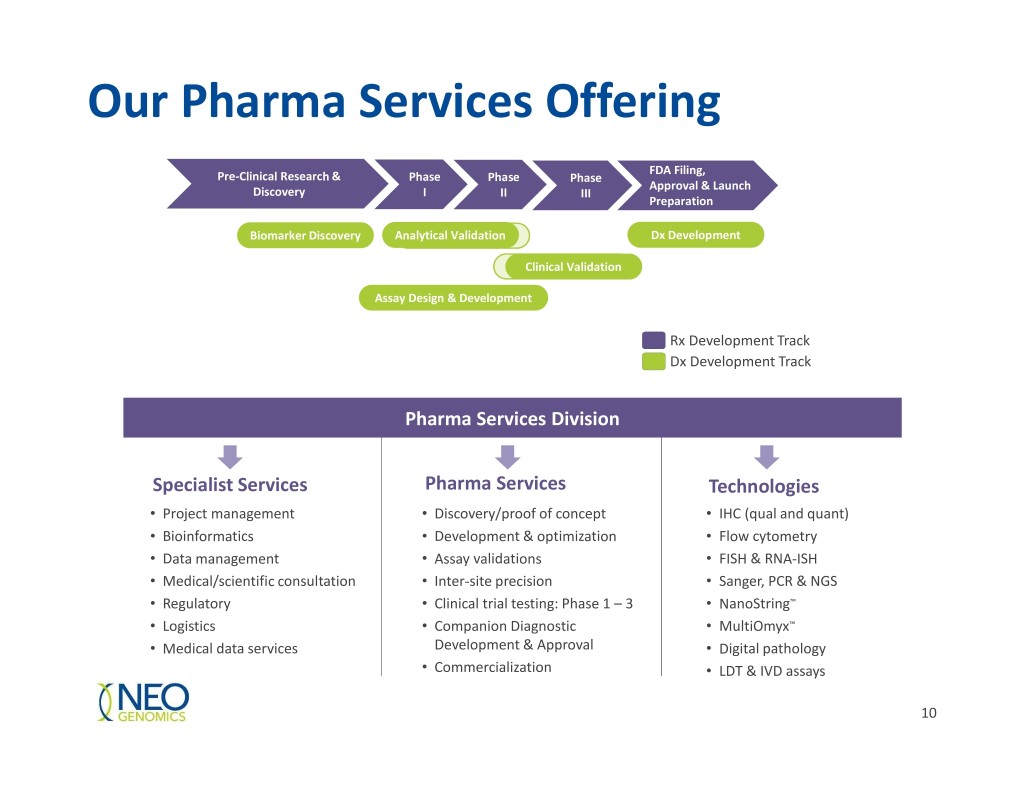
Our Pharma Services Offering FDA Filing, Pre-Clinical Research & Phase Phase Phase Approval & Launch Discovery I II III Preparation Biomarker Discovery Analytical Validation Dx Development Clinical Validation Assay Design & Development Rx Development Track Dx Development Track Pharma Services Division Specialist Services Pharma Services Technologies • Project management • Discovery/proof of concept • IHC (qual and quant) • Bioinformatics • Development & optimization • Flow cytometry • Data management • Assay validations • FISH & RNA-ISH • Medical/scientific consultation • Inter-site precision • Sanger, PCR & NGS • Regulatory • Clinical trial testing: Phase 1 – 3 • NanoString™ • Logistics • Companion Diagnostic • MultiOmyx™ • Medical data services Development & Approval • Digital pathology • Commercialization • LDT & IVD assays 10
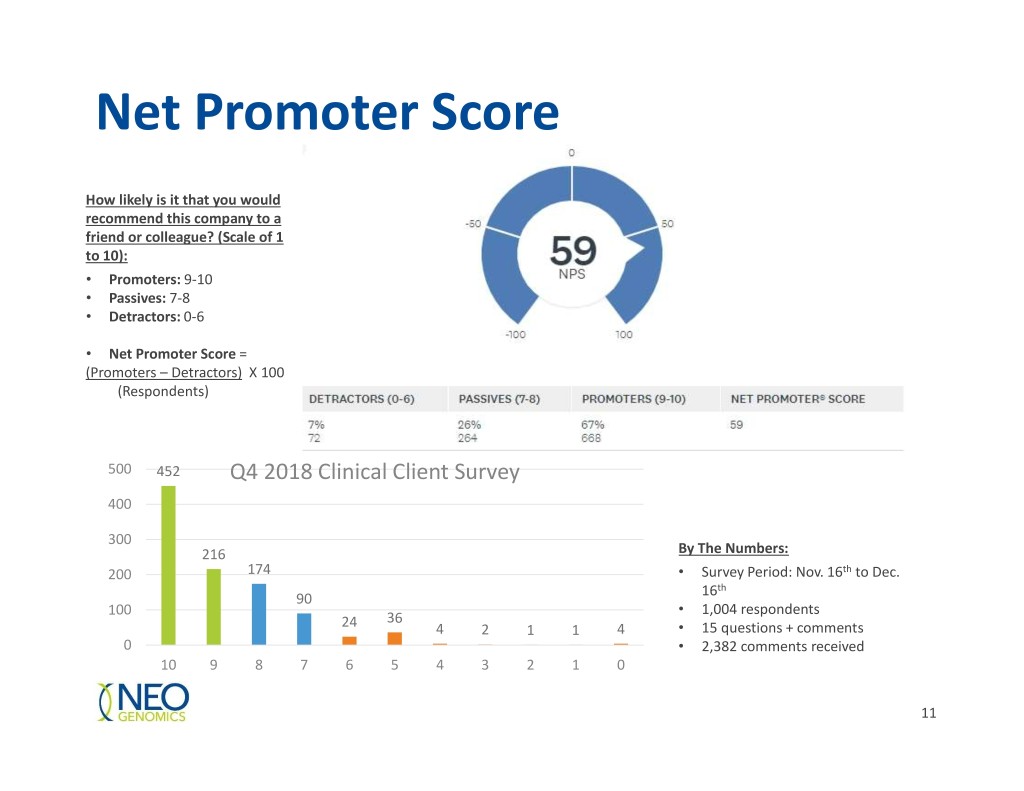
Net Promoter Score How likely is it that you would recommend this company to a friend or colleague? (Scale of 1 to 10): • Promoters: 9-10 • Passives: 7-8 • Detractors: 0-6 • Net Promoter Score = (Promoters – Detractors) X 100 (Respondents) 500 452 Q4 2018 Clinical Client Survey 400 300 216 By The Numbers: 200 174 • Survey Period: Nov. 16th to Dec. 16th 90 100 • 1,004 respondents 24 36 4 2 1 1 4 • 15 questions + comments 0 • 2,382 comments received 10 9 8 7 6 5 4 3 2 1 0 11
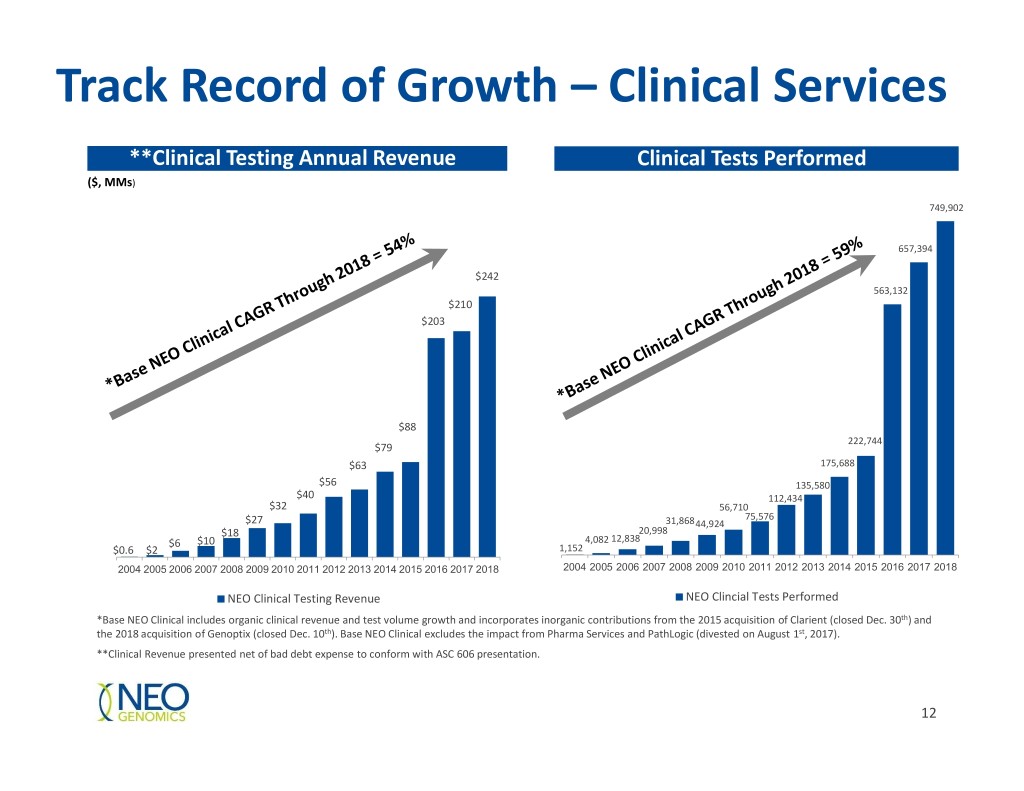
Track Record of Growth – Clinical Services **Clinical Testing Annual Revenue Clinical Tests Performed ($, MMs) 749,902 657,394 $242 563,132 $210 $203 $88 222,744 $79 $63 175,688 $56 135,580 $40 112,434 $32 56,710 75,576 $27 31,868 44,924 $18 20,998 $6 $10 4,082 12,838 $0.6 $2 1,152 2004 2005 2006 2007 2008 2009 2010 2011 2012 2013 2014 2015 2016 2017 2018 2004 2005 2006 2007 2008 2009 2010 2011 2012 2013 2014 2015 2016 2017 2018 NEO Clinical Testing Revenue NEO Clincial Tests Performed *Base NEO Clinical includes organic clinical revenue and test volume growth and incorporates inorganic contributions from the 2015 acquisition of Clarient (closed Dec. 30th) and the 2018 acquisition of Genoptix (closed Dec. 10th). Base NEO Clinical excludes the impact from Pharma Services and PathLogic (divested on August 1st, 2017). **Clinical Revenue presented net of bad debt expense to conform with ASC 606 presentation. 12
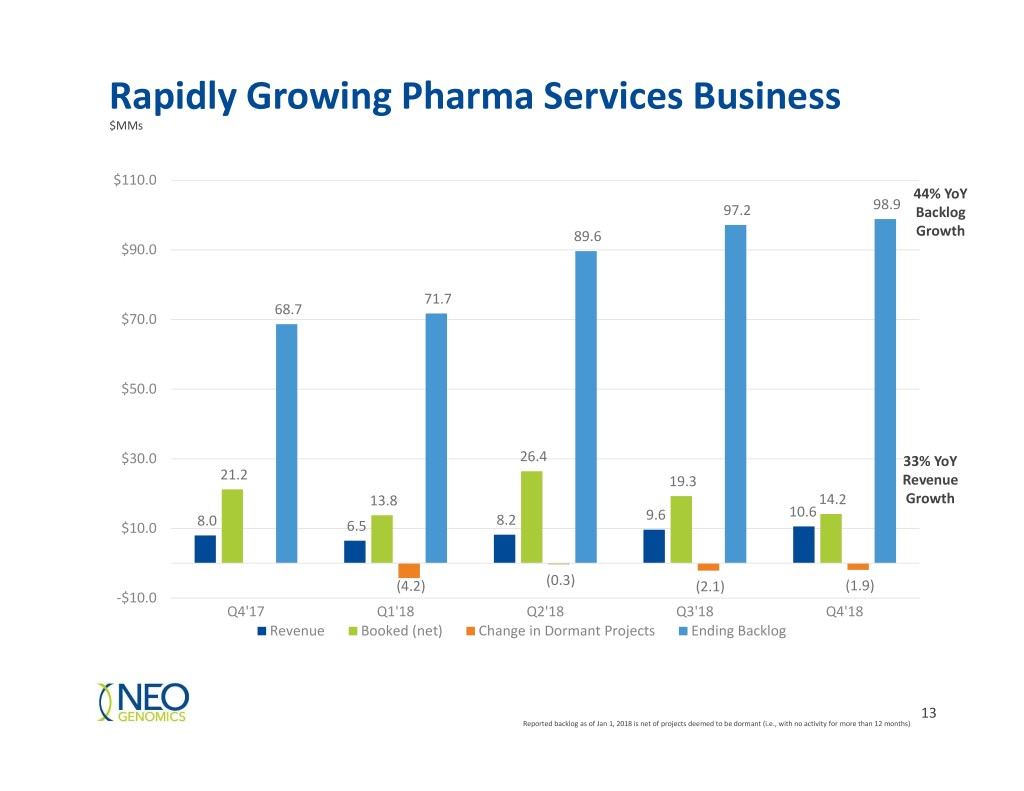
Rapidly Growing Pharma Services Business $MMs $110.0 44% YoY 98.9 97.2 Backlog 89.6 Growth $90.0 71.7 68.7 $70.0 $50.0 $30.0 26.4 33% YoY 21.2 19.3 Revenue 13.8 14.2 Growth 10.6 8.2 9.6 $10.0 8.0 6.5 (4.2) (0.3) (2.1) (1.9) -$10.0 Q4'17 Q1'18 Q2'18 Q3'18 Q4'18 Revenue Booked (net) Change in Dormant Projects Ending Backlog 13 Reported backlog as of Jan 1, 2018 is net of projects deemed to be dormant (i.e., with no activity for more than 12 months)
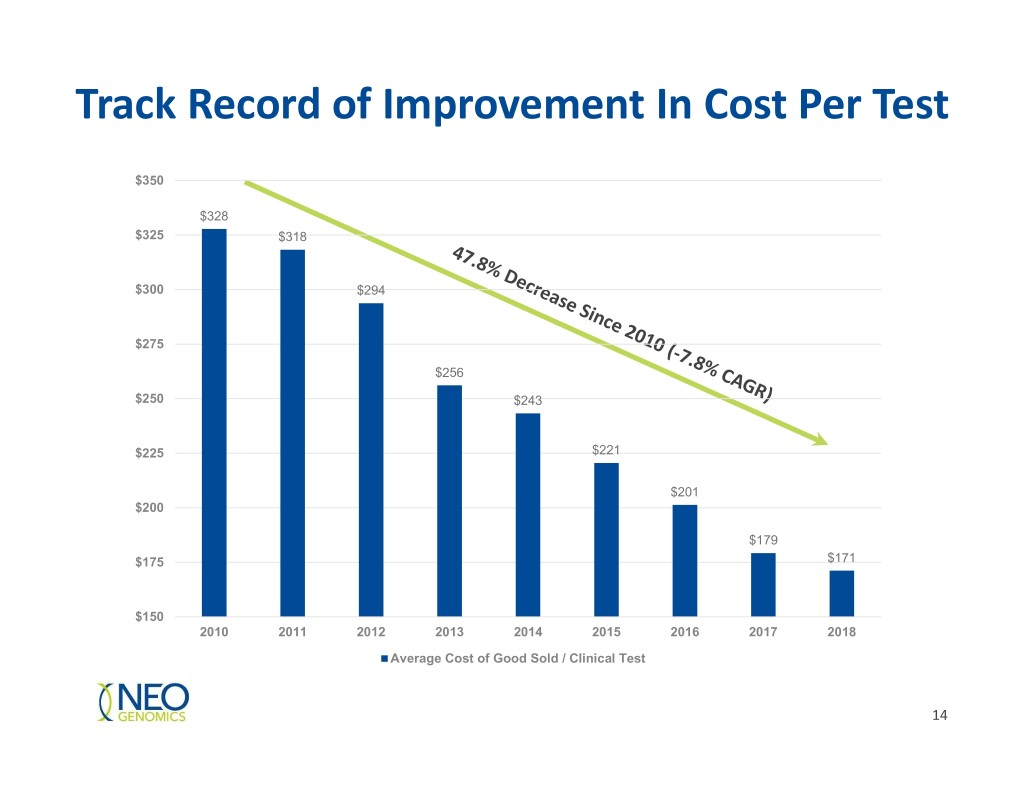
Track Record of Improvement In Cost Per Test $350 $328 $325 $318 $300 $294 $275 $256 $250 $243 $225 $221 $201 $200 $179 $175 $171 $150 2010 2011 2012 2013 2014 2015 2016 2017 2018 Average Cost of Good Sold / Clinical Test 14
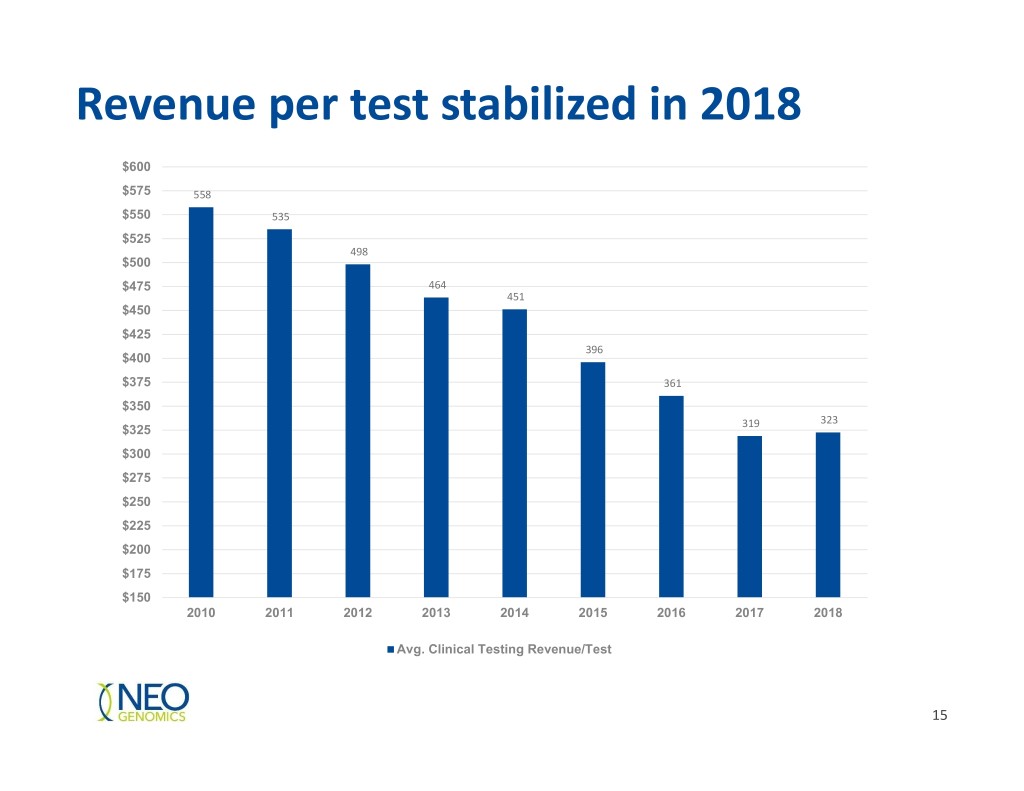
Revenue per test stabilized in 2018 $600 $575 558 $550 535 $525 498 $500 $475 464 451 $450 $425 396 $400 $375 361 $350 323 $325 319 $300 $275 $250 $225 $200 $175 $150 2010 2011 2012 2013 2014 2015 2016 2017 2018 Avg. Clinical Testing Revenue/Test 15
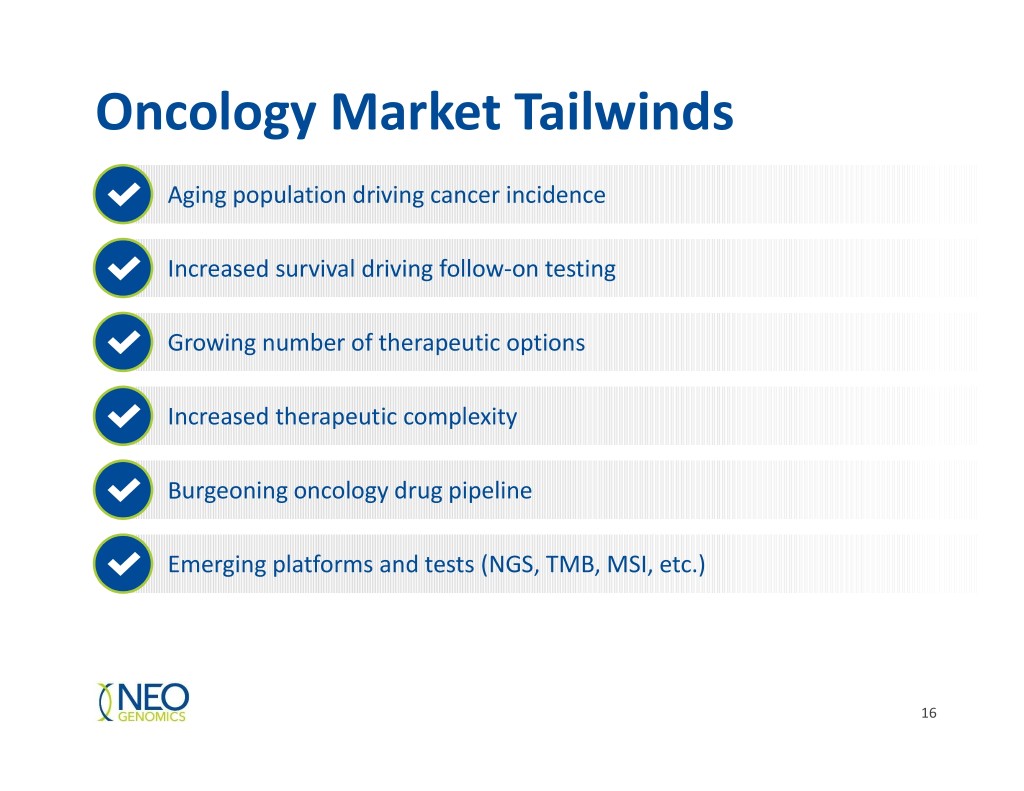
Oncology Market Tailwinds Aging population driving cancer incidence Increased survival driving follow-on testing Growing number of therapeutic options Increased therapeutic complexity Burgeoning oncology drug pipeline Emerging platforms and tests (NGS, TMB, MSI, etc.) 16
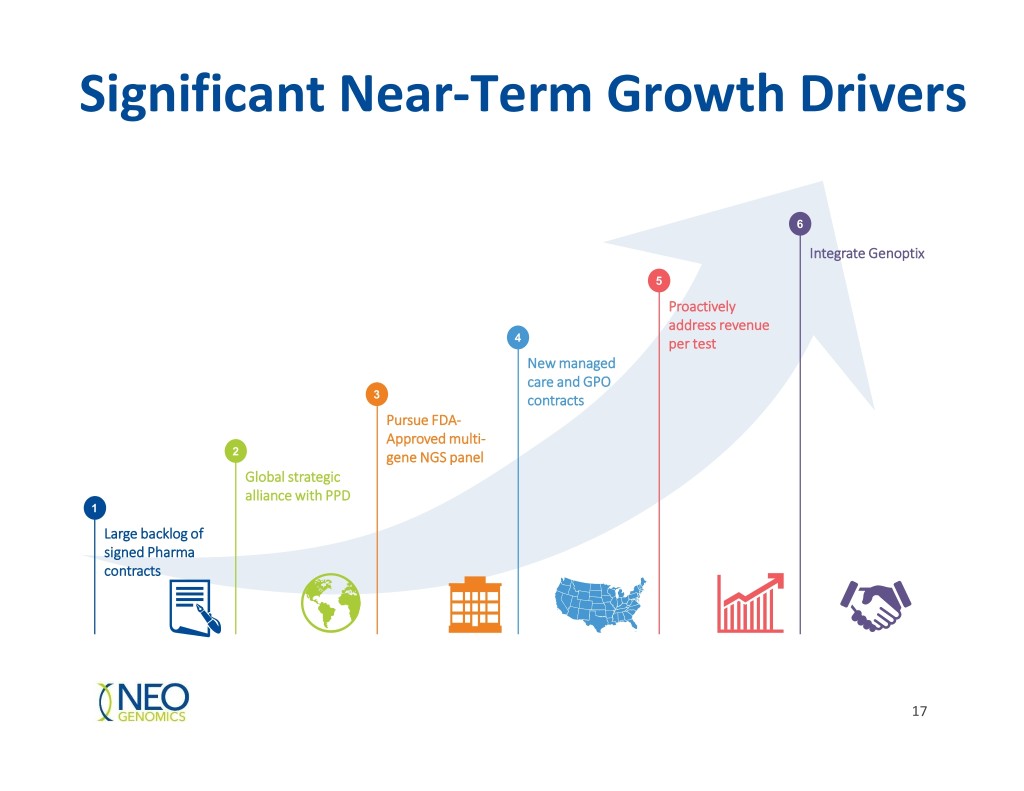
Significant Near-Term Growth Drivers 6 Integrate Genoptix 5 Proactively address revenue 4 per test New managed care and GPO 3 contracts Pursue FDA- Approved multi- 2 gene NGS panel Global strategic alliance with PPD 1 Large backlog of signed Pharma contracts 17
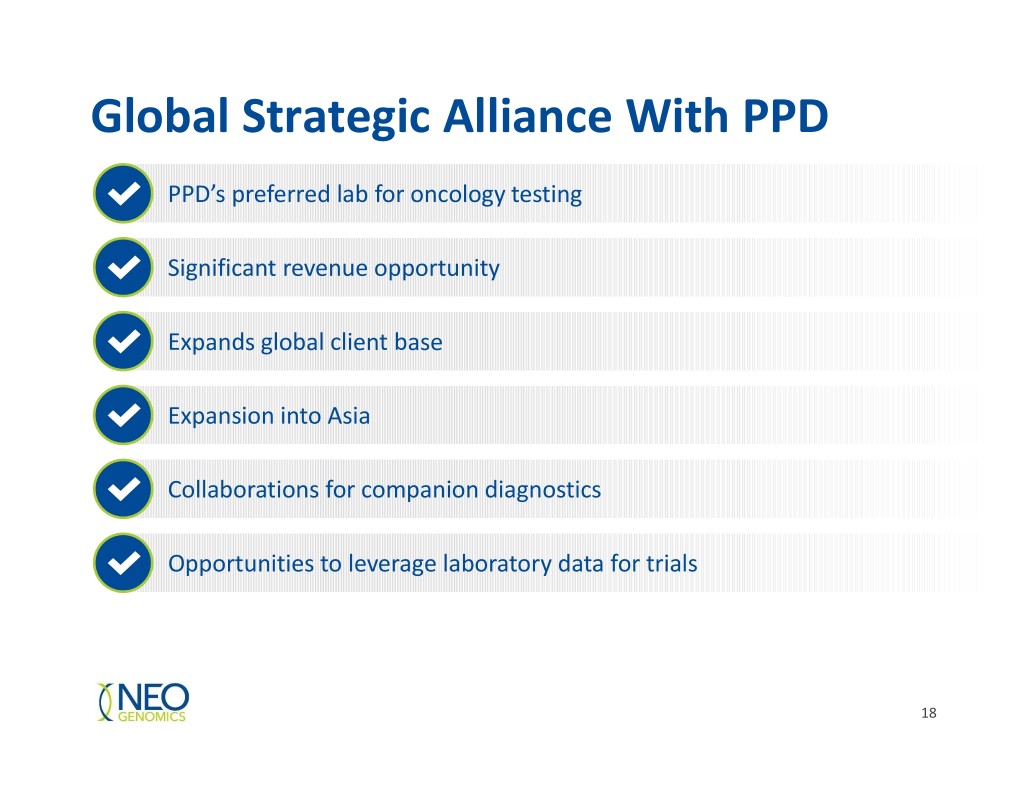
Global Strategic Alliance With PPD PPD’s preferred lab for oncology testing Significant revenue opportunity Expands global client base Expansion into Asia Collaborations for companion diagnostics Opportunities to leverage laboratory data for trials 18
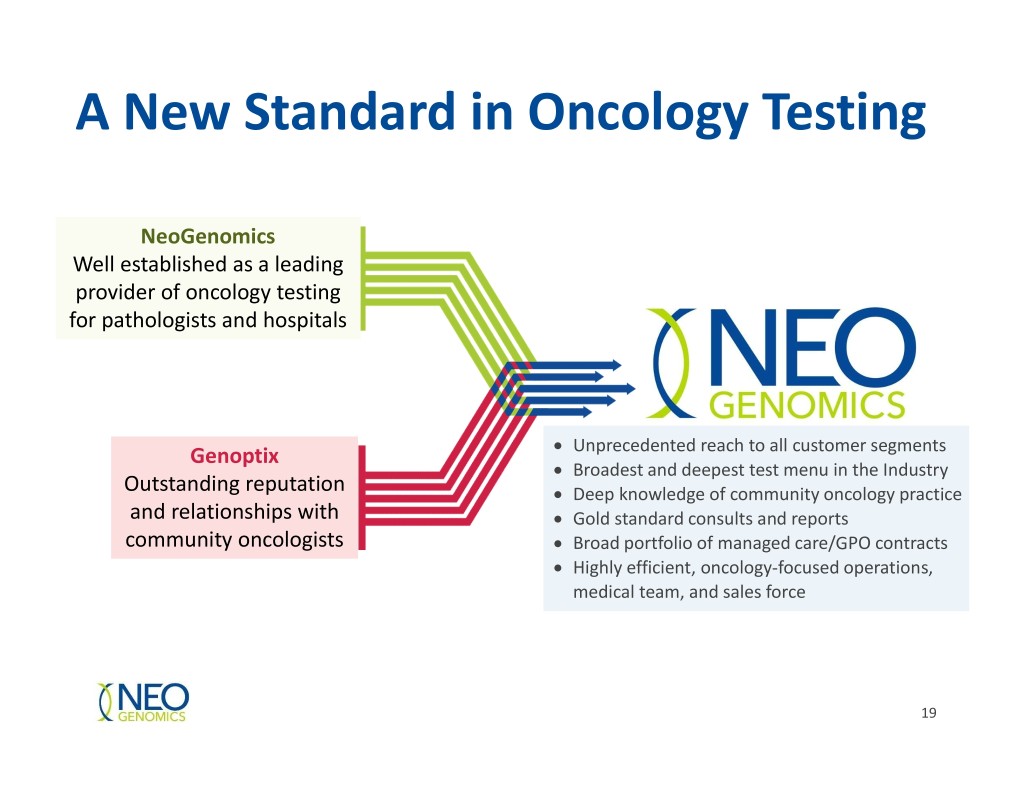
A New Standard in Oncology Testing NeoGenomics Well established as a leading provider of oncology testing for pathologists and hospitals Genoptix Unprecedented reach to all customer segments Broadest and deepest test menu in the Industry Outstanding reputation Deep knowledge of community oncology practice and relationships with Gold standard consults and reports community oncologists Broad portfolio of managed care/GPO contracts Highly efficient, oncology-focused operations, medical team, and sales force 19
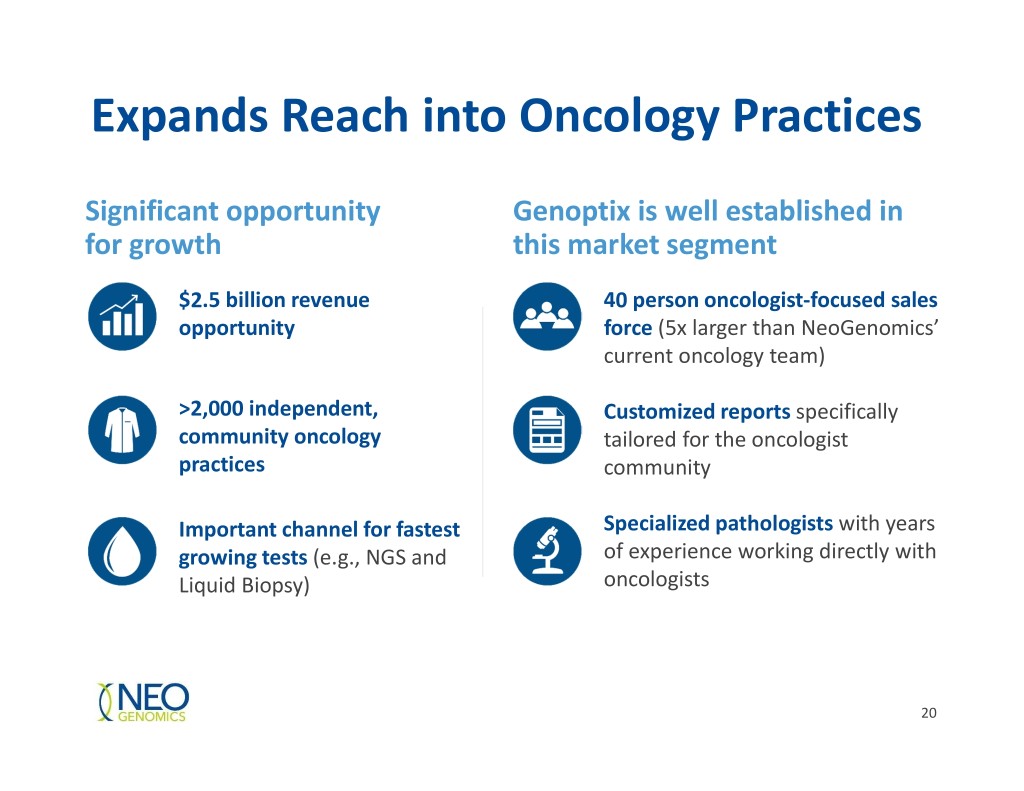
Expands Reach into Oncology Practices Significant opportunity Genoptix is well established in for growth this market segment $2.5 billion revenue 40 person oncologist-focused sales opportunity force (5x larger than NeoGenomics’ current oncology team) >2,000 independent, Customized reports specifically community oncology tailored for the oncologist practices community Important channel for fastest Specialized pathologists with years growing tests (e.g., NGS and of experience working directly with Liquid Biopsy) oncologists 20
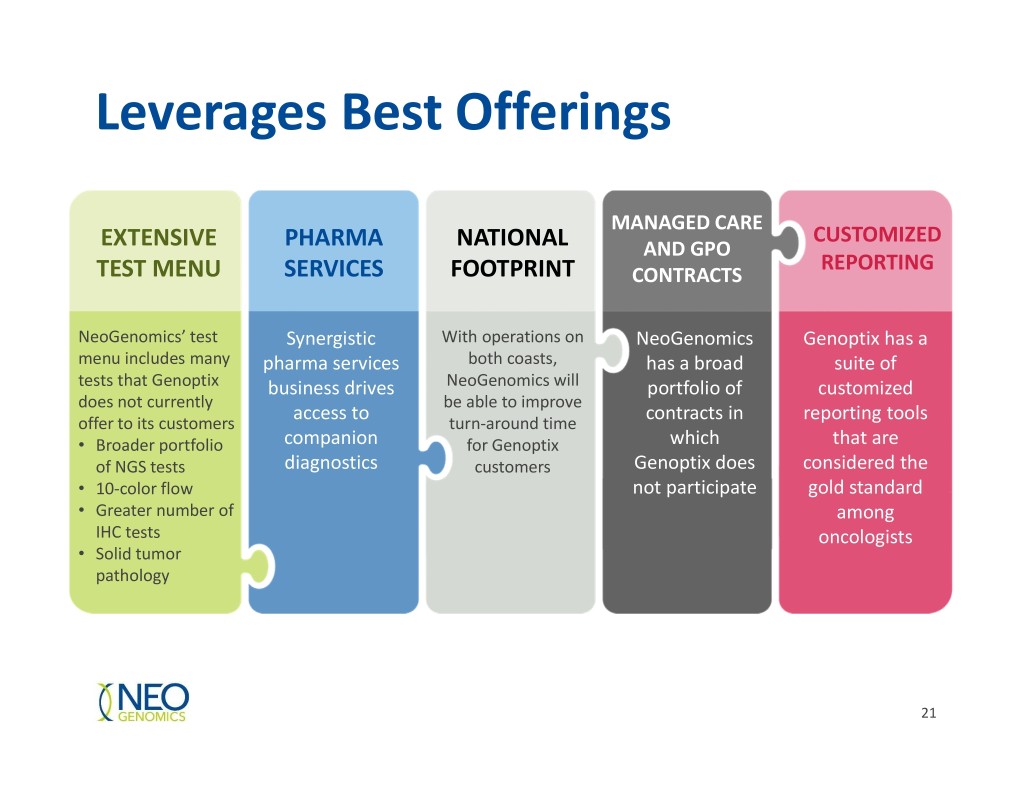
Leverages Best Offerings MANAGED CARE CUSTOMIZED EXTENSIVE PHARMA NATIONAL AND GPO REPORTING TEST MENU SERVICES FOOTPRINT CONTRACTS NeoGenomics’ test Synergistic With operations on NeoGenomics Genoptix has a menu includes many pharma services both coasts, has a broad suite of tests that Genoptix business drives NeoGenomics will portfolio of customized does not currently be able to improve access to contracts in reporting tools offer to its customers turn-around time • Broader portfolio companion for Genoptix which that are of NGS tests diagnostics customers Genoptix does considered the • 10-color flow not participate gold standard • Greater number of among IHC tests oncologists • Solid tumor pathology 21
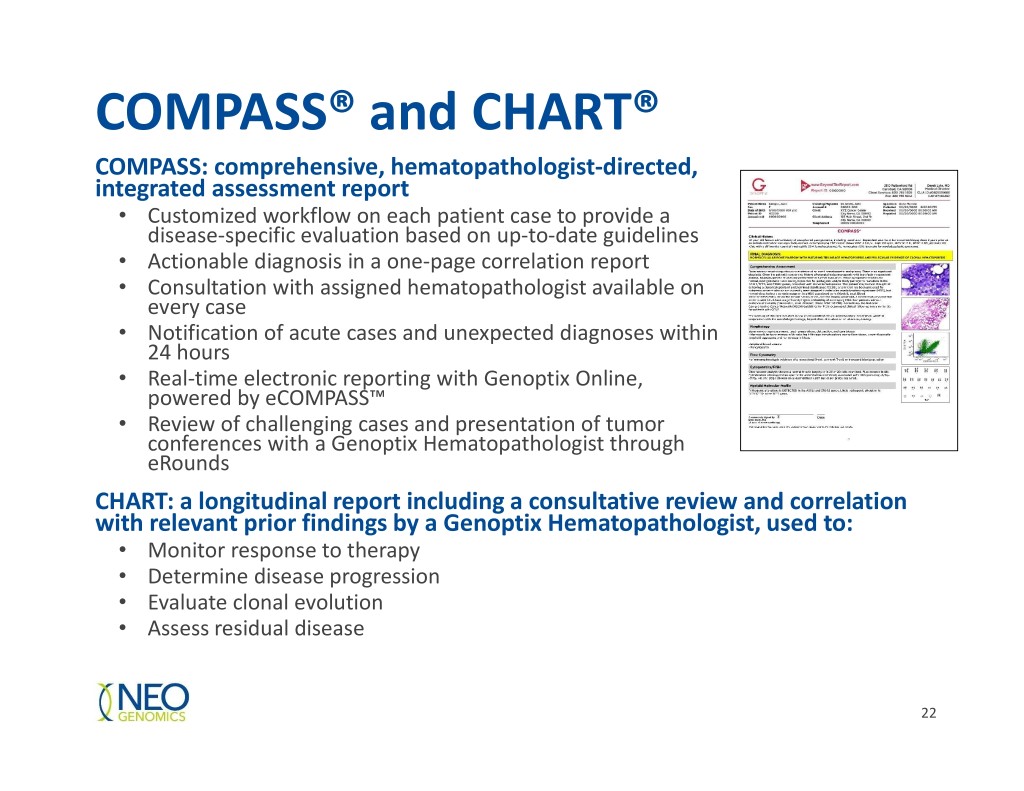
COMPASS® and CHART® COMPASS: comprehensive, hematopathologist-directed, integrated assessment report • Customized workflow on each patient case to provide a disease-specific evaluation based on up-to-date guidelines • Actionable diagnosis in a one-page correlation report • Consultation with assigned hematopathologist available on every case • Notification of acute cases and unexpected diagnoses within 24 hours • Real-time electronic reporting with Genoptix Online, powered by eCOMPASS™ • Review of challenging cases and presentation of tumor conferences with a Genoptix Hematopathologist through eRounds CHART: a longitudinal report including a consultative review and correlation with relevant prior findings by a Genoptix Hematopathologist, used to: • Monitor response to therapy • Determine disease progression • Evaluate clonal evolution • Assess residual disease 22
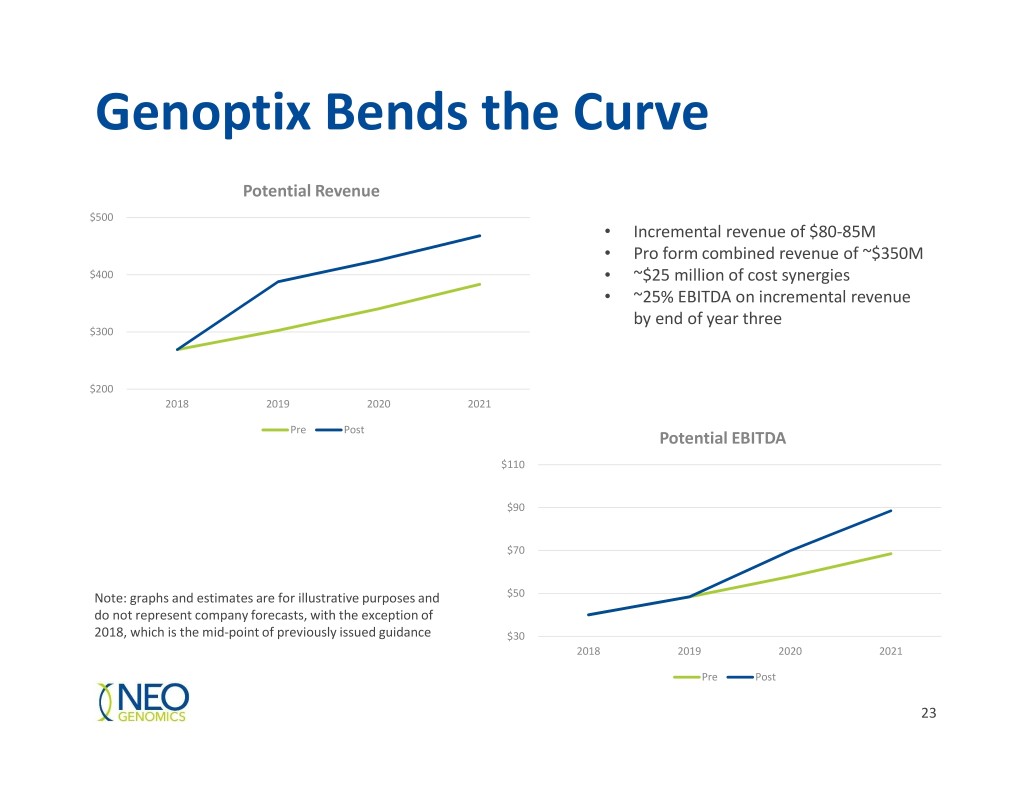
Genoptix Bends the Curve Potential Revenue $500 • Incremental revenue of $80-85M • Pro form combined revenue of ~$350M $400 • ~$25 million of cost synergies • ~25% EBITDA on incremental revenue by end of year three $300 $200 2018 2019 2020 2021 Pre Post Potential EBITDA $110 $90 $70 Note: graphs and estimates are for illustrative purposes and $50 do not represent company forecasts, with the exception of 2018, which is the mid-point of previously issued guidance $30 2018 2019 2020 2021 Pre Post 23
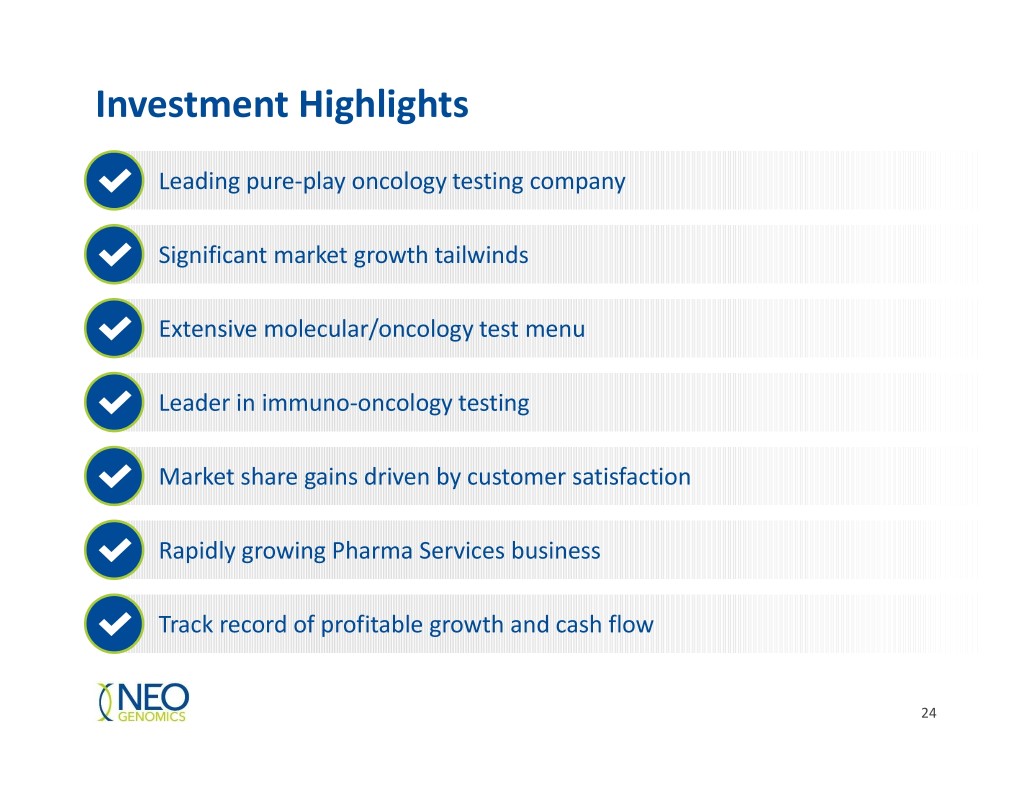
Investment Highlights Leading pure-play oncology testing company Significant market growth tailwinds Extensive molecular/oncology test menu Leader in immuno-oncology testing Market share gains driven by customer satisfaction Rapidly growing Pharma Services business Track record of profitable growth and cash flow 24
Appendix 25
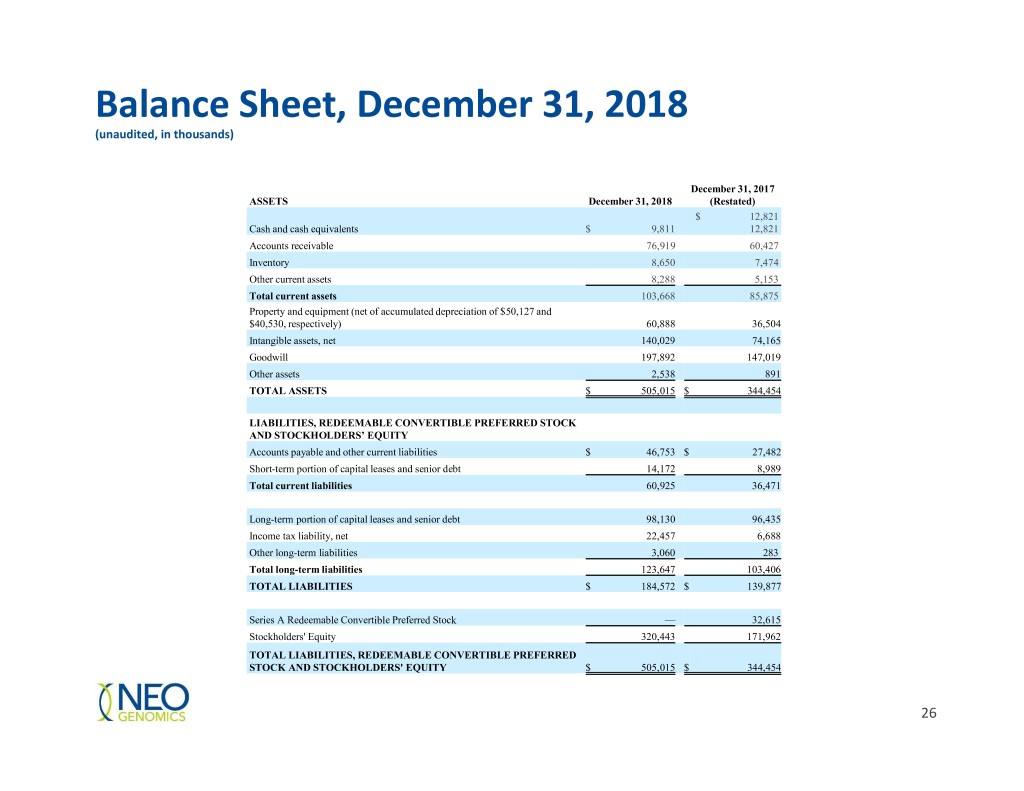
Balance Sheet, December 31, 2018 (unaudited, in thousands) December 31, 2017 ASSETS December 31, 2018 (Restated) $ 12,821 Cash and cash equivalents $ 9,811 12,821 Accounts receivable 76,919 60,427 Inventory 8,650 7,474 Other current assets 8,288 5,153 Total current assets 103,668 85,875 Property and equipment (net of accumulated depreciation of $50,127 and $40,530, respectively) 60,888 36,504 Intangible assets, net 140,029 74,165 Goodwill 197,892 147,019 Other assets 2,538 891 TOTAL ASSETS $ 505,015 $ 344,454 LIABILITIES, REDEEMABLE CONVERTIBLE PREFERRED STOCK AND STOCKHOLDERS’ EQUITY Accounts payable and other current liabilities $ 46,753 $ 27,482 Short-term portion of capital leases and senior debt 14,172 8,989 Total current liabilities 60,925 36,471 Long-term portion of capital leases and senior debt 98,130 96,435 Income tax liability, net 22,457 6,688 Other long-term liabilities 3,060 283 Total long-term liabilities 123,647 103,406 TOTAL LIABILITIES $ 184,572 $ 139,877 Series A Redeemable Convertible Preferred Stock — 32,615 Stockholders' Equity 320,443 171,962 TOTAL LIABILITIES, REDEEMABLE CONVERTIBLE PREFERRED STOCK AND STOCKHOLDERS' EQUITY $ 505,015 $ 344,454 26
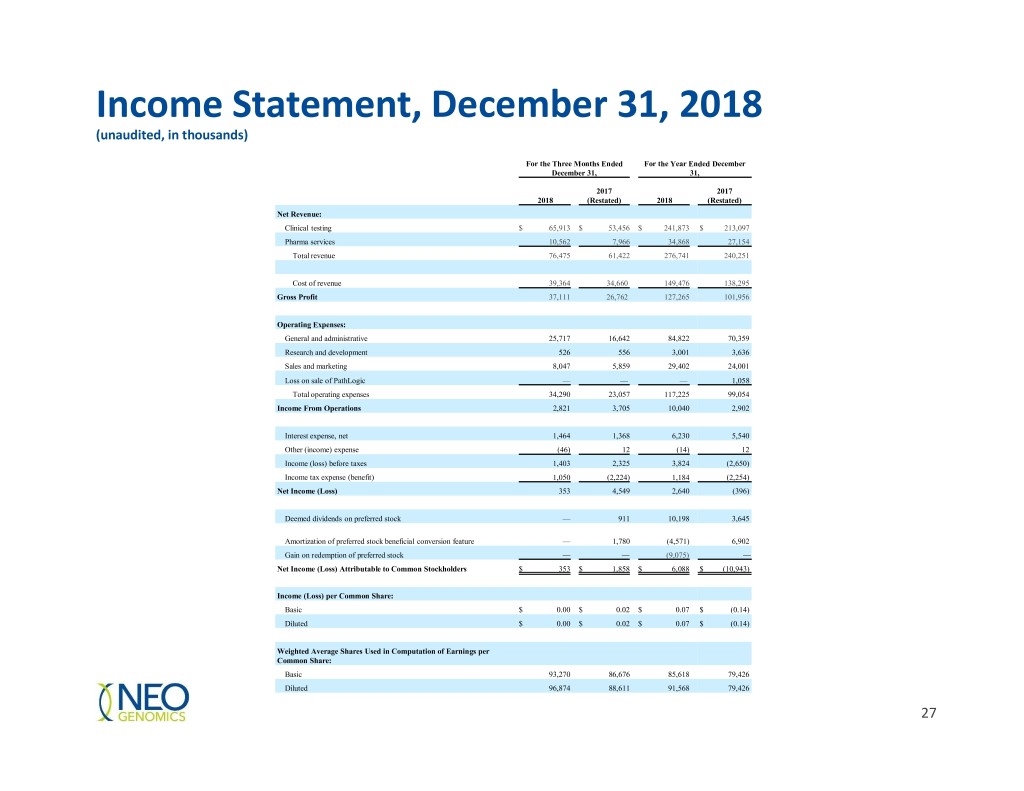
Income Statement, December 31, 2018 (unaudited, in thousands) For the Three Months Ended For the Year Ended December December 31, 31, 2017 2017 2018 (Restated) 2018 (Restated) Net Revenue: Clinical testing $ 65,913 $ 53,456 $ 241,873 $ 213,097 Pharma services 10,562 7,966 34,868 27,154 Total revenue 76,475 61,422 276,741 240,251 Cost of revenue 39,364 34,660 149,476 138,295 Gross Profit 37,111 26,762 127,265 101,956 Operating Expenses: General and administrative 25,717 16,642 84,822 70,359 Research and development 526 556 3,001 3,636 Sales and marketing 8,047 5,859 29,402 24,001 Loss on sale of PathLogic — — — 1,058 Total operating expenses 34,290 23,057 117,225 99,054 Income From Operations 2,821 3,705 10,040 2,902 Interest expense, net 1,464 1,368 6,230 5,540 Other (income) expense (46) 12 (14) 12 Income (loss) before taxes 1,403 2,325 3,824 (2,650) Income tax expense (benefit) 1,050 (2,224) 1,184 (2,254) Net Income (Loss) 353 4,549 2,640 (396) Deemed dividends on preferred stock — 911 10,198 3,645 Amortization of preferred stock beneficial conversion feature — 1,780 (4,571) 6,902 Gain on redemption of preferred stock — — (9,075) — Net Income (Loss) Attributable to Common Stockholders $ 353 $ 1,858 $ 6,088 $ (10,943) Income (Loss) per Common Share: Basic $ 0.00 $ 0.02 $ 0.07 $ (0.14) Diluted $ 0.00 $ 0.02 $ 0.07 $ (0.14) Weighted Average Shares Used in Computation of Earnings per Common Share: Basic 93,270 86,676 85,618 79,426 Diluted 96,874 88,611 91,568 79,426 27
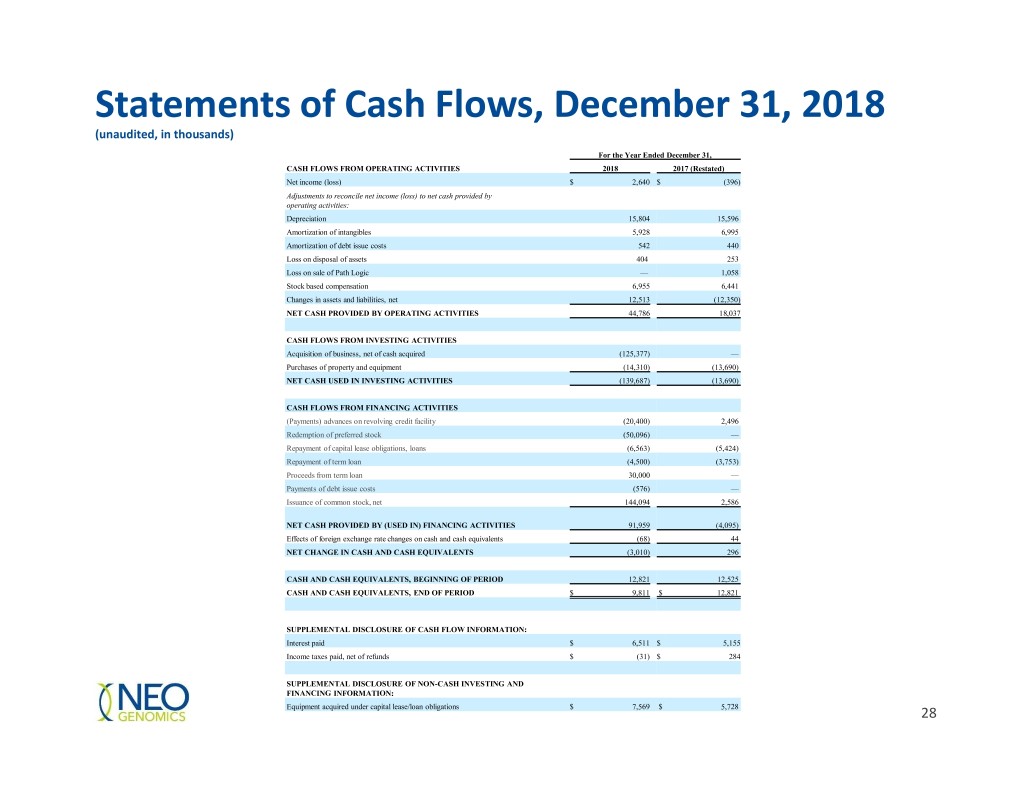
Statements of Cash Flows, December 31, 2018 (unaudited, in thousands) For the Year Ended December 31, CASH FLOWS FROM OPERATING ACTIVITIES 2018 2017 (Restated) Net income (loss) $ 2,640 $ (396) Adjustments to reconcile net income (loss) to net cash provided by operating activities: Depreciation 15,804 15,596 Amortization of intangibles 5,928 6,995 Amortization of debt issue costs 542 440 Loss on disposal of assets 404 253 Loss on sale of Path Logic — 1,058 Stock based compensation 6,955 6,441 Changes in assets and liabilities, net 12,513 (12,350) NET CASH PROVIDED BY OPERATING ACTIVITIES 44,786 18,037 CASH FLOWS FROM INVESTING ACTIVITIES Acquisition of business, net of cash acquired (125,377) — Purchases of property and equipment (14,310) (13,690) NET CASH USED IN INVESTING ACTIVITIES (139,687) (13,690) CASH FLOWS FROM FINANCING ACTIVITIES (Payments) advances on revolving credit facility (20,400) 2,496 Redemption of preferred stock (50,096) — Repayment of capital lease obligations, loans (6,563) (5,424) Repayment of term loan (4,500) (3,753) Proceeds from term loan 30,000 — Payments of debt issue costs (576) — Issuance of common stock, net 144,094 2,586 NET CASH PROVIDED BY (USED IN) FINANCING ACTIVITIES 91,959 (4,095) Effects of foreign exchange rate changes on cash and cash equivalents (68) 44 NET CHANGE IN CASH AND CASH EQUIVALENTS (3,010) 296 CASH AND CASH EQUIVALENTS, BEGINNING OF PERIOD 12,821 12,525 CASH AND CASH EQUIVALENTS, END OF PERIOD $ 9,811 $ 12,821 SUPPLEMENTAL DISCLOSURE OF CASH FLOW INFORMATION: Interest paid $ 6,511 $ 5,155 Income taxes paid, net of refunds $ (31) $ 284 SUPPLEMENTAL DISCLOSURE OF NON-CASH INVESTING AND FINANCING INFORMATION: Equipment acquired under capital lease/loan obligations $ 7,569 $ 5,728 28
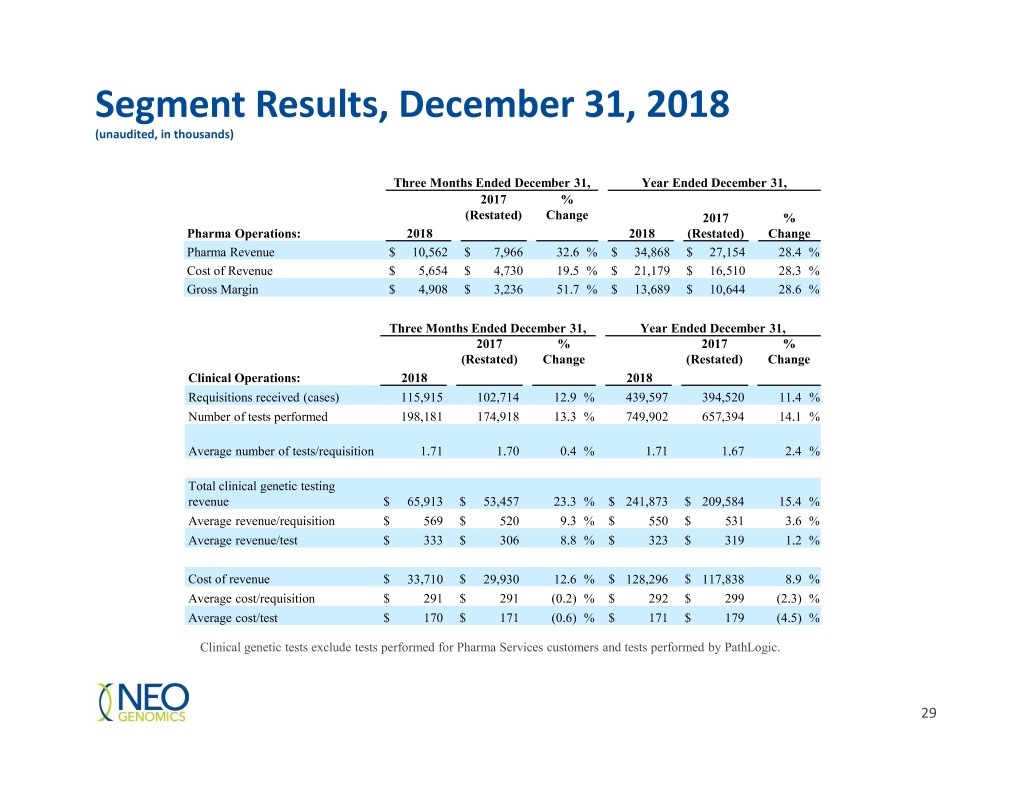
Segment Results, December 31, 2018 (unaudited, in thousands) Three Months Ended December 31, Year Ended December 31, 2017 % (Restated) Change 2017 % Pharma Operations: 2018 2018 (Restated) Change Pharma Revenue $ 10,562 $ 7,966 32.6 % $ 34,868 $ 27,154 28.4 % Cost of Revenue $ 5,654 $ 4,730 19.5 % $ 21,179 $ 16,510 28.3 % Gross Margin $ 4,908 $ 3,236 51.7 % $ 13,689 $ 10,644 28.6 % Three Months Ended December 31, Year Ended December 31, 2017 % 2017 % (Restated) Change (Restated) Change Clinical Operations: 2018 2018 Requisitions received (cases) 115,915 102,714 12.9 % 439,597 394,520 11.4 % Number of tests performed 198,181 174,918 13.3 % 749,902 657,394 14.1 % Average number of tests/requisition 1.71 1.70 0.4 % 1.71 1.67 2.4 % Total clinical genetic testing revenue $ 65,913 $ 53,457 23.3 % $ 241,873 $ 209,584 15.4 % Average revenue/requisition $ 569 $ 520 9.3 % $ 550 $ 531 3.6 % Average revenue/test $ 333 $ 306 8.8 % $ 323 $ 319 1.2 % Cost of revenue $ 33,710 $ 29,930 12.6 % $ 128,296 $ 117,838 8.9 % Average cost/requisition $ 291 $ 291 (0.2) % $ 292 $ 299 (2.3) % Average cost/test $ 170 $ 171 (0.6) % $ 171 $ 179 (4.5) % Clinical genetic tests exclude tests performed for Pharma Services customers and tests performed by PathLogic. 29
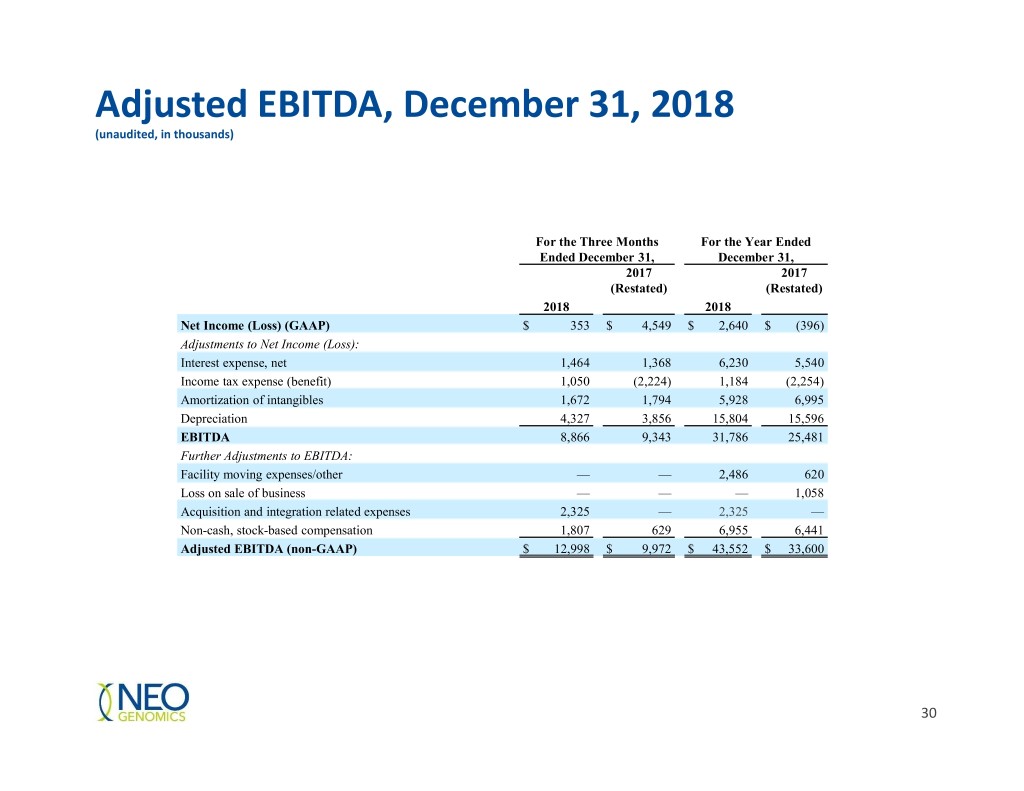
Adjusted EBITDA, December 31, 2018 (unaudited, in thousands) For the Three Months For the Year Ended Ended December 31, December 31, 2017 2017 (Restated) (Restated) 2018 2018 Net Income (Loss) (GAAP) $ 353 $ 4,549 $ 2,640 $ (396) Adjustments to Net Income (Loss): Interest expense, net 1,464 1,368 6,230 5,540 Income tax expense (benefit) 1,050 (2,224) 1,184 (2,254) Amortization of intangibles 1,672 1,794 5,928 6,995 Depreciation 4,327 3,856 15,804 15,596 EBITDA 8,866 9,343 31,786 25,481 Further Adjustments to EBITDA: Facility moving expenses/other — — 2,486 620 Loss on sale of business — — — 1,058 Acquisition and integration related expenses 2,325 — 2,325 — Non-cash, stock-based compensation 1,807 629 6,955 6,441 Adjusted EBITDA (non-GAAP) $ 12,998 $ 9,972 $ 43,552 $ 33,600 30
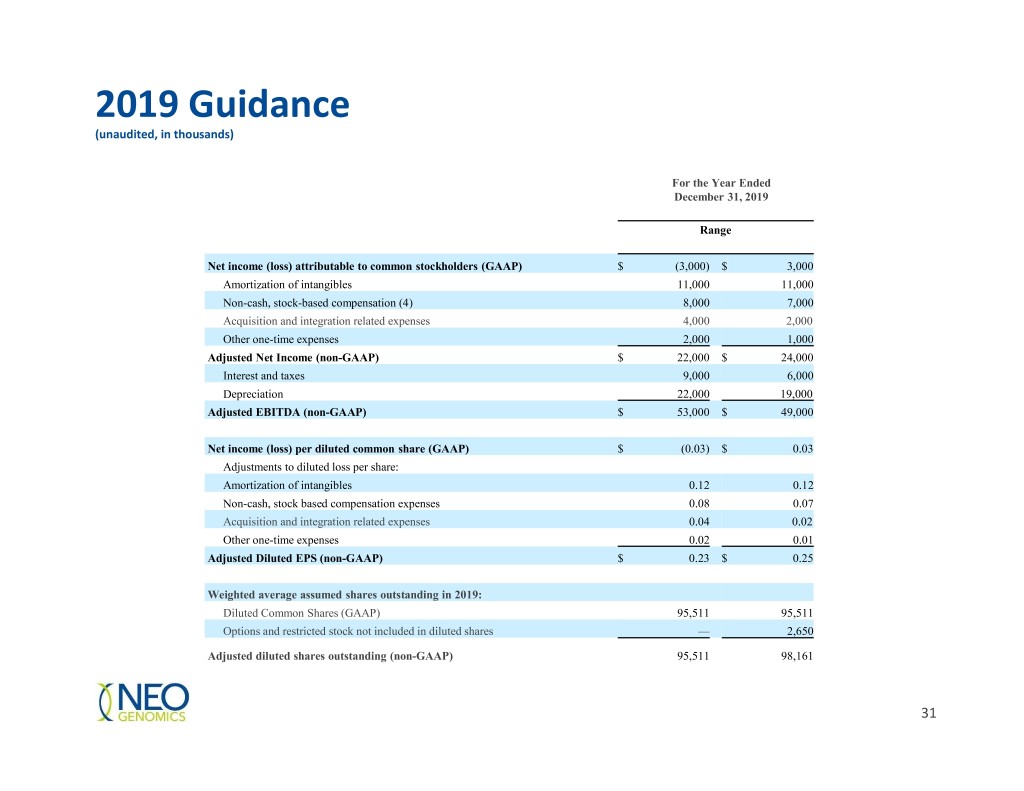
2019 Guidance (unaudited, in thousands) For the Year Ended December 31, 2019 Range Net income (loss) attributable to common stockholders (GAAP) $ (3,000) $ 3,000 Amortization of intangibles 11,000 11,000 Non-cash, stock-based compensation (4) 8,000 7,000 Acquisition and integration related expenses 4,000 2,000 Other one-time expenses 2,000 1,000 Adjusted Net Income (non-GAAP) $ 22,000 $ 24,000 Interest and taxes 9,000 6,000 Depreciation 22,000 19,000 Adjusted EBITDA (non-GAAP) $ 53,000 $ 49,000 Net income (loss) per diluted common share (GAAP) $ (0.03) $ 0.03 Adjustments to diluted loss per share: Amortization of intangibles 0.12 0.12 Non-cash, stock based compensation expenses 0.08 0.07 Acquisition and integration related expenses 0.04 0.02 Other one-time expenses 0.02 0.01 Adjusted Diluted EPS (non-GAAP) $ 0.23 $ 0.25 Weighted average assumed shares outstanding in 2019: Diluted Common Shares (GAAP) 95,511 95,511 Options and restricted stock not included in diluted shares — 2,650 Adjusted diluted shares outstanding (non-GAAP) 95,511 98,161 31
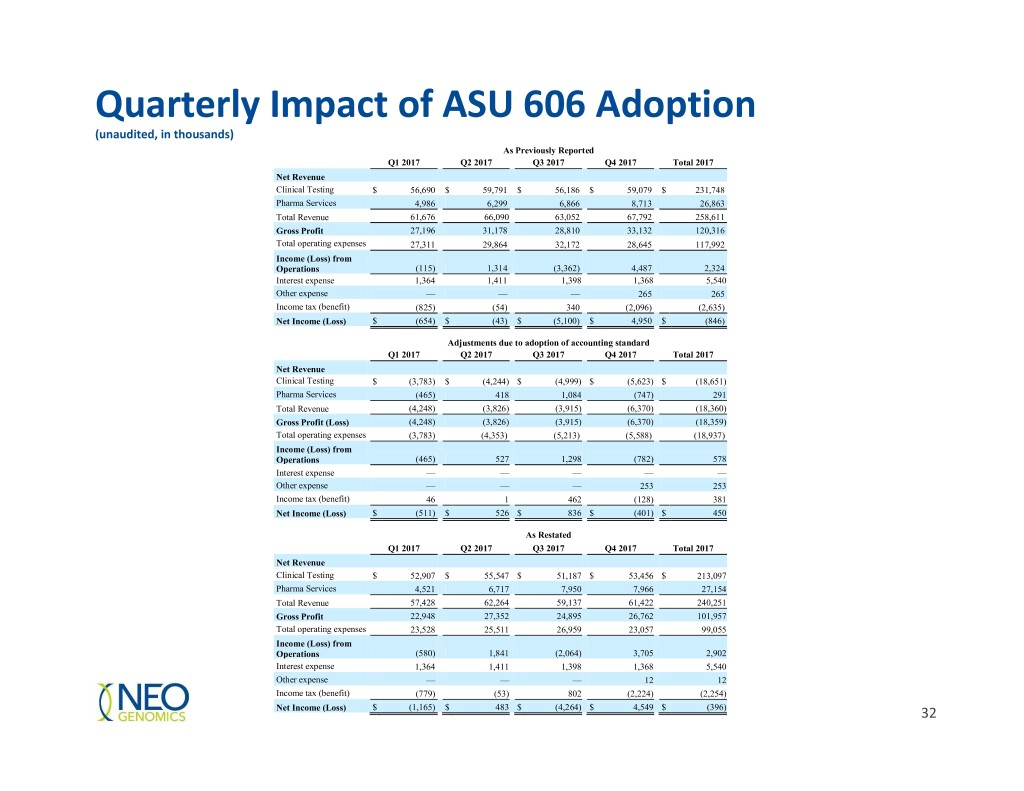
Quarterly Impact of ASU 606 Adoption (unaudited, in thousands) As Previously Reported Q1 2017 Q2 2017 Q3 2017 Q4 2017 Total 2017 Net Revenue Clinical Testing $ 56,690 $ 59,791 $ 56,186 $ 59,079 $ 231,748 Pharma Services 4,986 6,299 6,866 8,713 26,863 Total Revenue 61,676 66,090 63,052 67,792 258,611 Gross Profit 27,196 31,178 28,810 33,132 120,316 Total operating expenses 27,311 29,864 32,172 28,645 117,992 Income (Loss) from Operations (115) 1,314 (3,362) 4,487 2,324 Interest expense 1,364 1,411 1,398 1,368 5,540 Other expense — — — 265 265 Income tax (benefit) (825) (54) 340 (2,096) (2,635) expense Net Income (Loss) $ (654) $ (43) $ (5,100) $ 4,950 $ (846) Adjustments due to adoption of accounting standard Q1 2017 Q2 2017 Q3 2017 Q4 2017 Total 2017 Net Revenue Clinical Testing $ (3,783) $ (4,244) $ (4,999) $ (5,623) $ (18,651) Pharma Services (465) 418 1,084 (747) 291 Total Revenue (4,248) (3,826) (3,915) (6,370) (18,360) Gross Profit (Loss) (4,248) (3,826) (3,915) (6,370) (18,359) Total operating expenses (3,783) (4,353) (5,213) (5,588) (18,937) Income (Loss) from Operations (465) 527 1,298 (782) 578 Interest expense — — — — — Other expense — — — 253 253 Income tax (benefit) 46 1 462 (128) 381 expense Net Income (Loss) $ (511) $ 526 $ 836 $ (401) $ 450 As Restated Q1 2017 Q2 2017 Q3 2017 Q4 2017 Total 2017 Net Revenue Clinical Testing $ 52,907 $ 55,547 $ 51,187 $ 53,456 $ 213,097 Pharma Services 4,521 6,717 7,950 7,966 27,154 Total Revenue 57,428 62,264 59,137 61,422 240,251 Gross Profit 22,948 27,352 24,895 26,762 101,957 Total operating expenses 23,528 25,511 26,959 23,057 99,055 Income (Loss) from Operations (580) 1,841 (2,064) 3,705 2,902 Interest expense 1,364 1,411 1,398 1,368 5,540 Other expense — — — 12 12 Income tax (benefit) (779) (53) 802 (2,224) (2,254) expense Net Income (Loss) $ (1,165) $ 483 $ (4,264) $ 4,549 $ (396) 32
