EX-99.1
Published on January 11, 2021

Exhibit 99.1
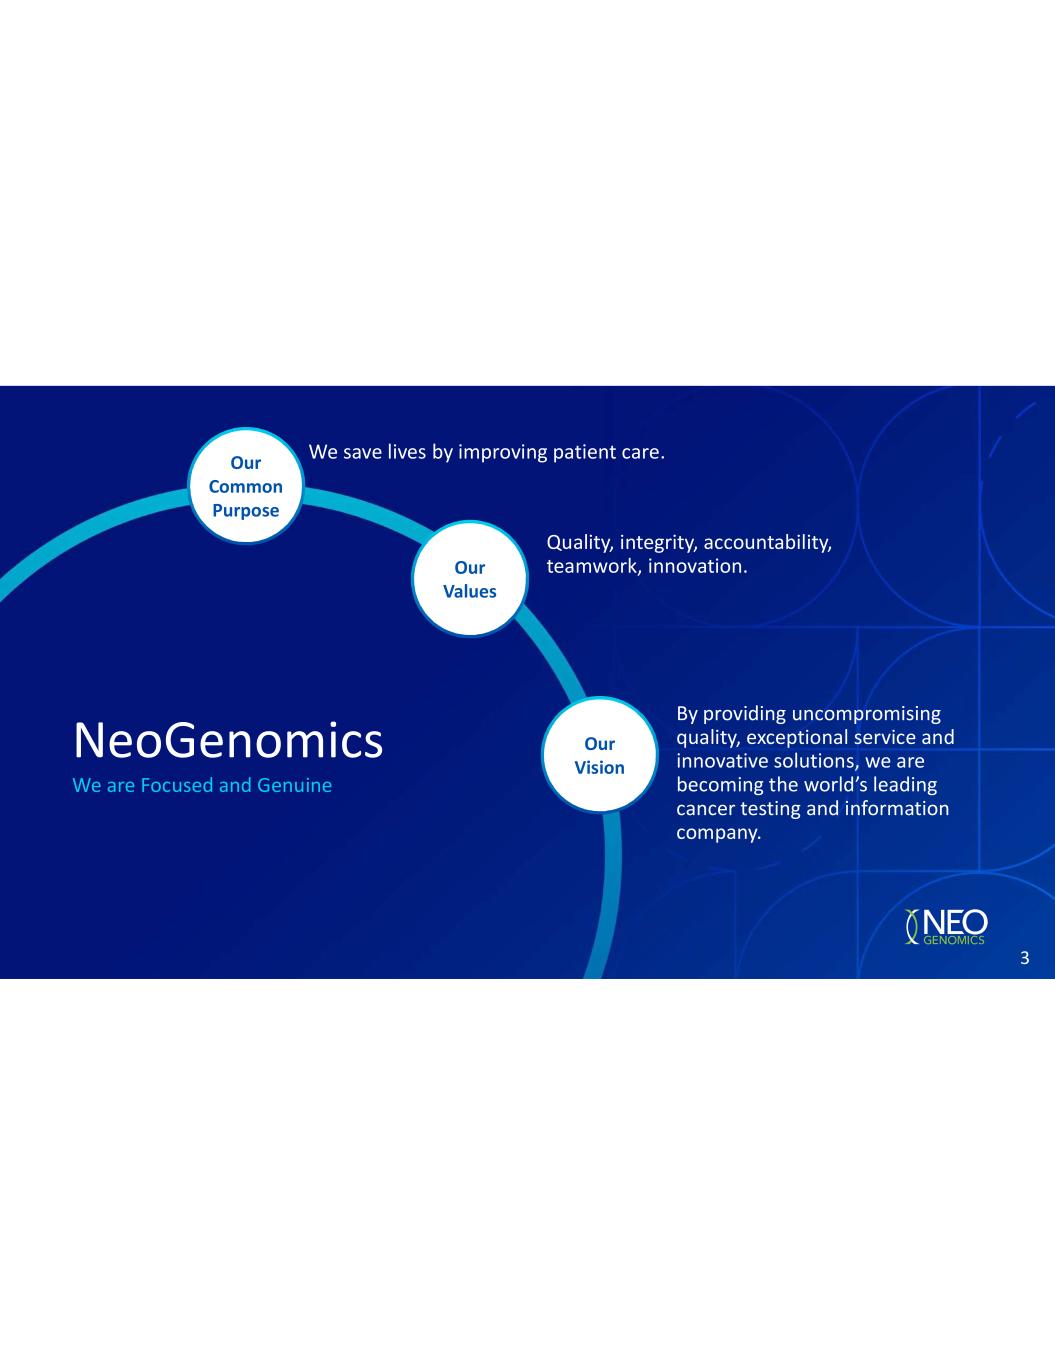
Our Common Purpose Our Values Our Vision
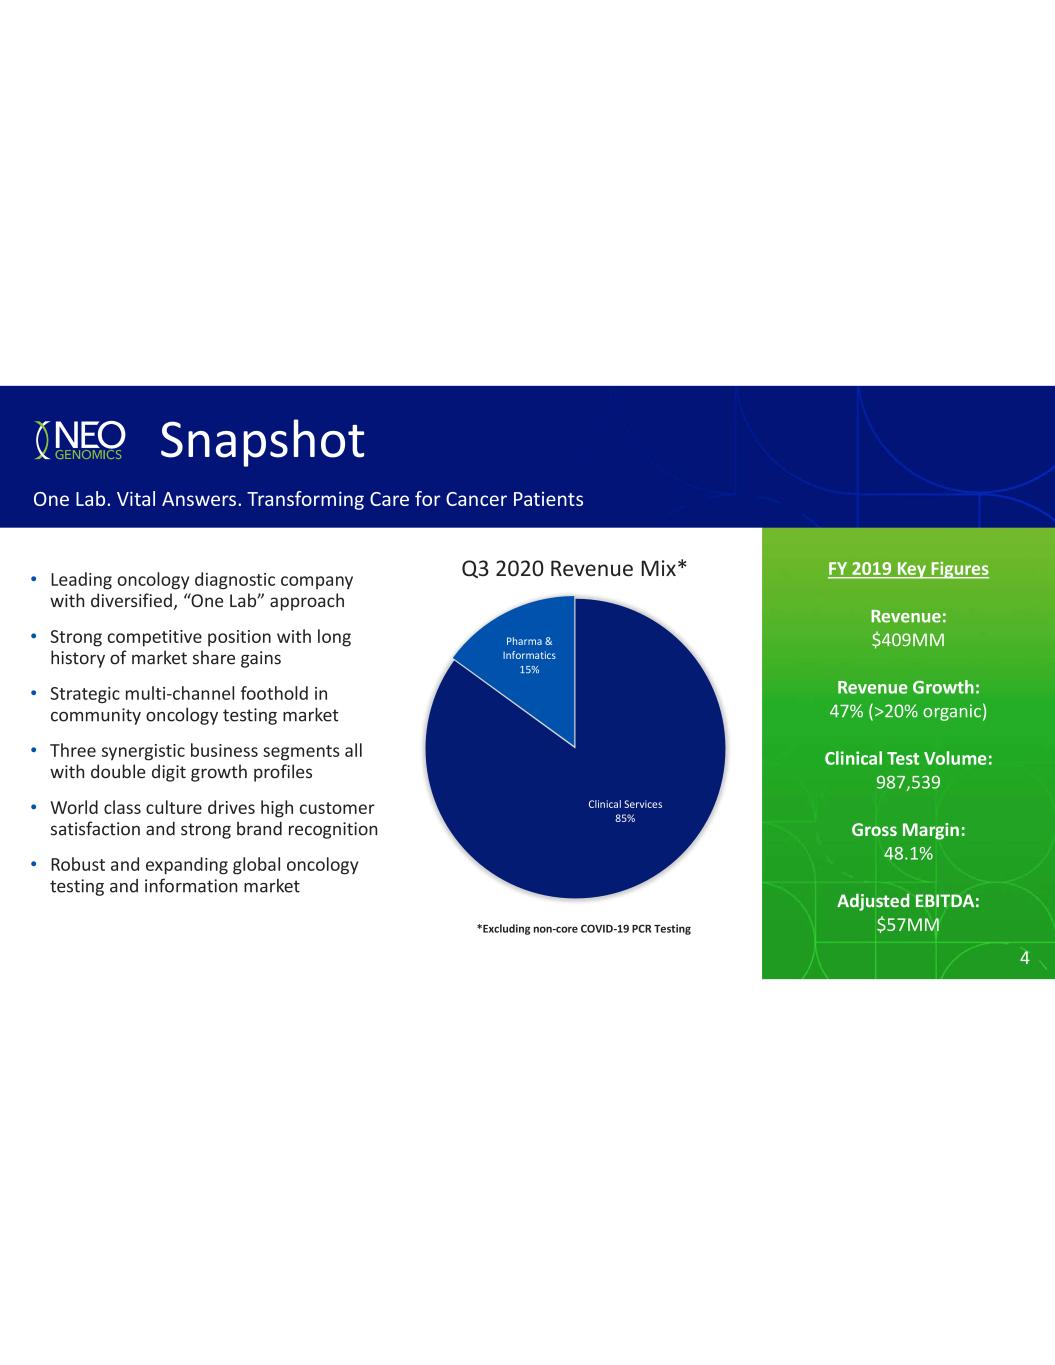
FY 2019 Key Figures Revenue: Revenue Growth: Clinical Test Volume: Gross Margin: Adjusted EBITDA: • • • • • • *Excluding non-core COVID-19 PCR Testing
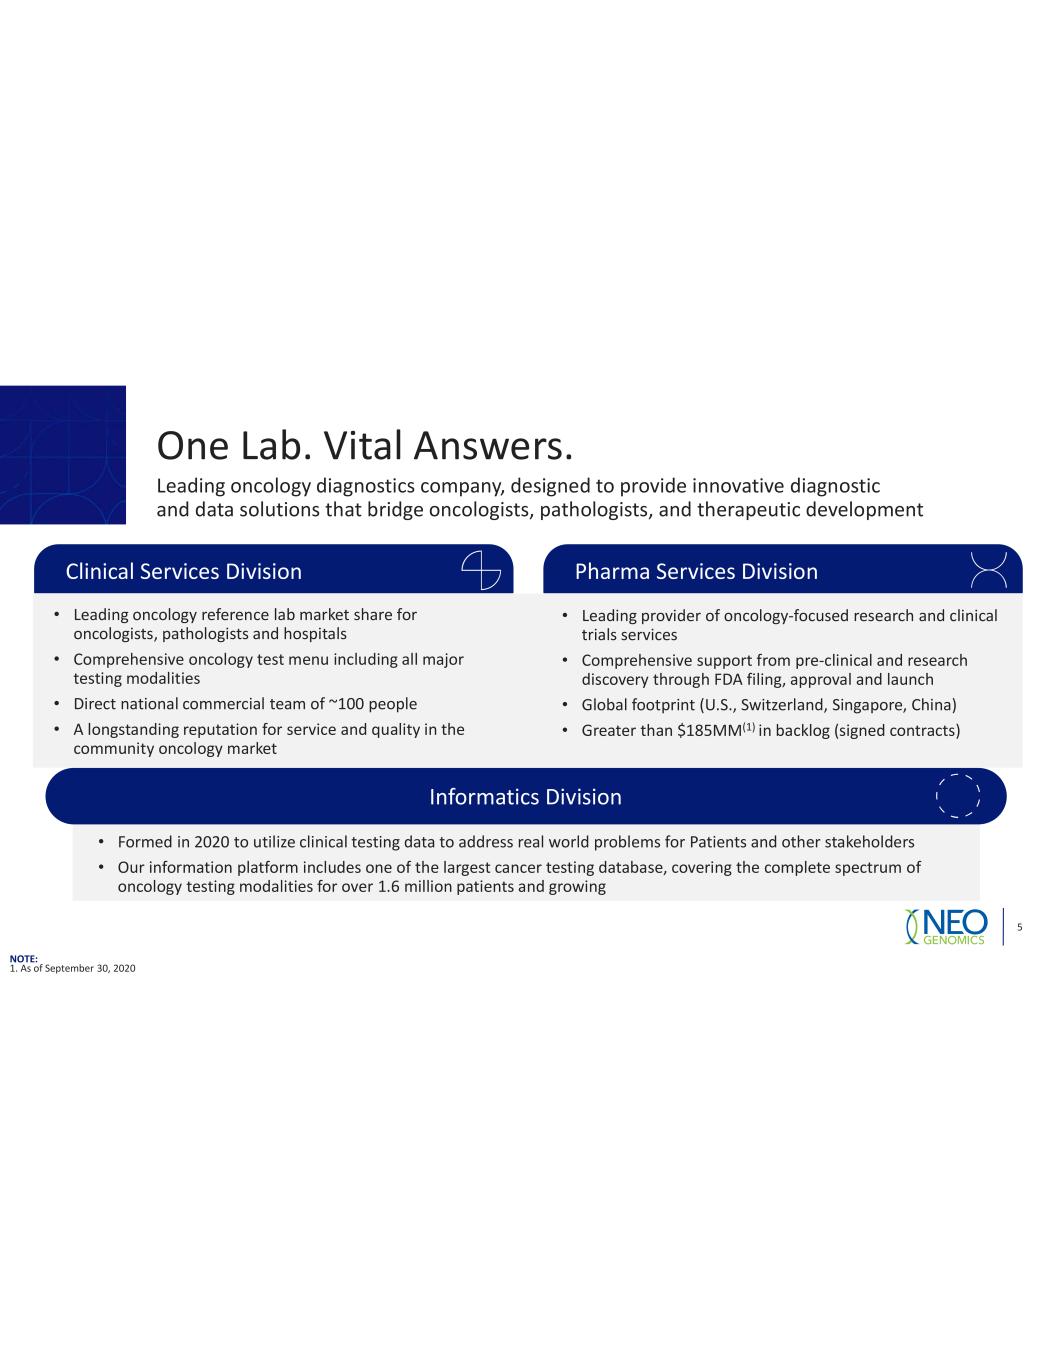
• • • • • • • • • • NOTE:
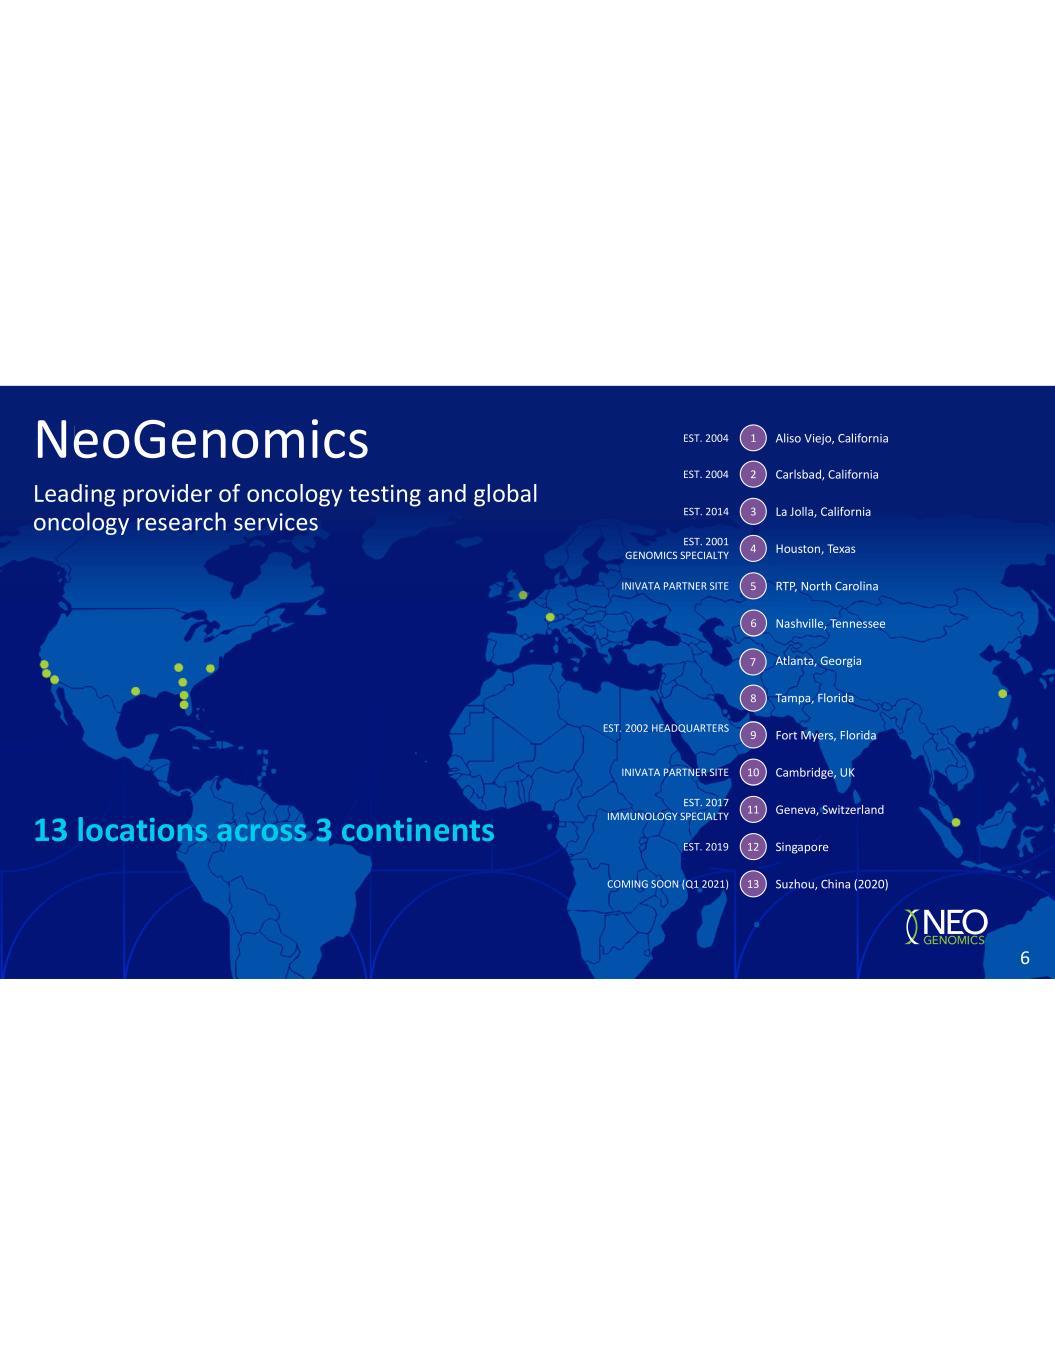
13 locations across 3 continents
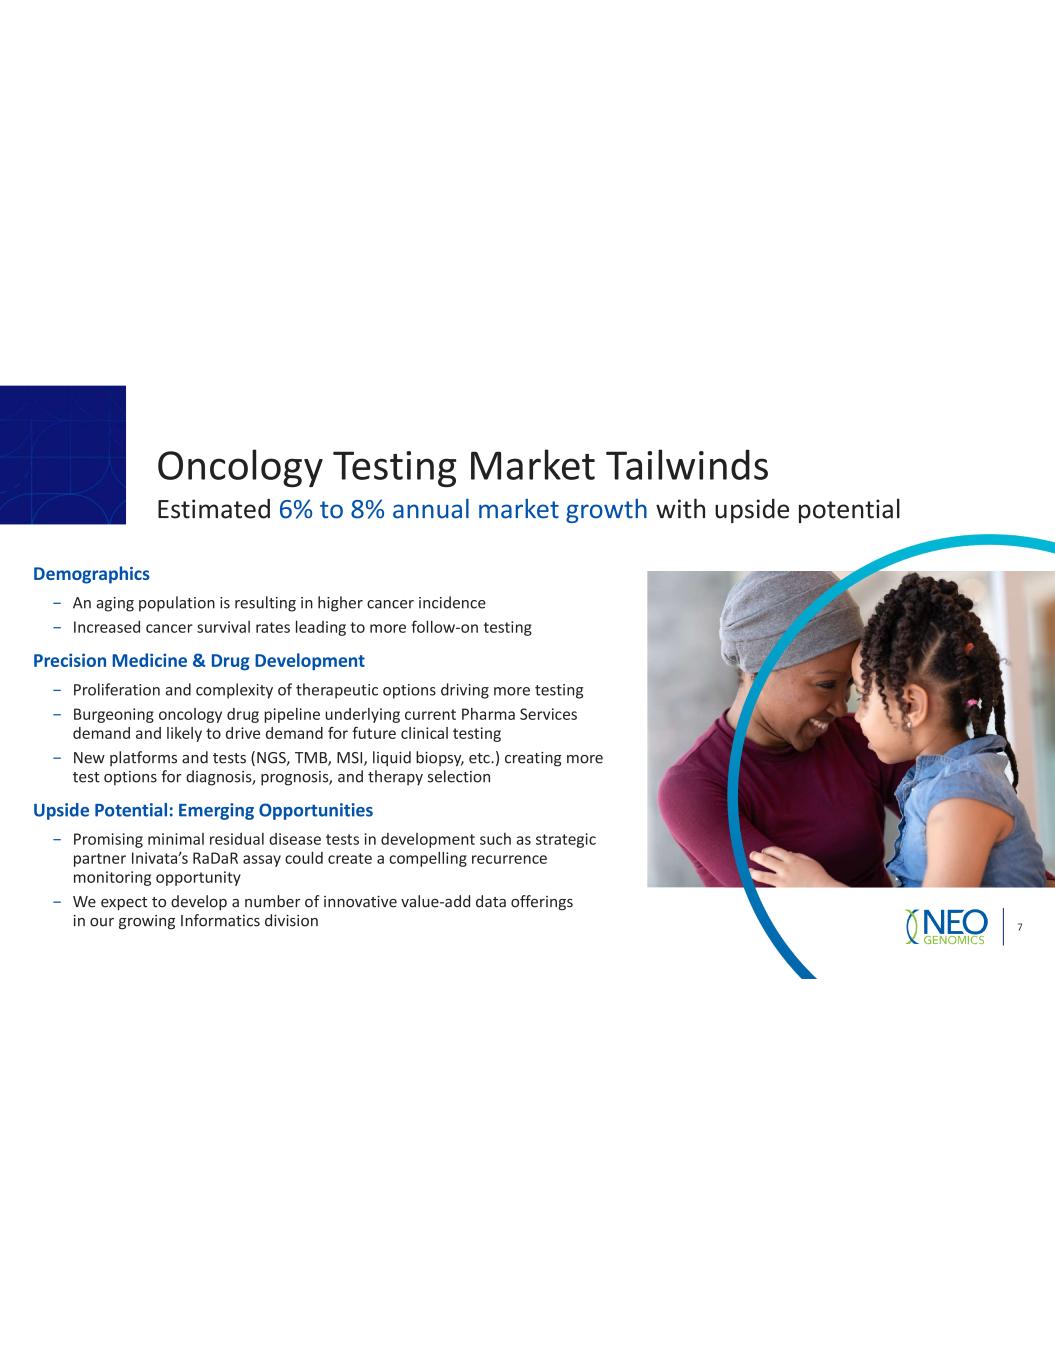
Demographics Precision Medicine & Drug Development Upside Potential: Emerging Opportunities
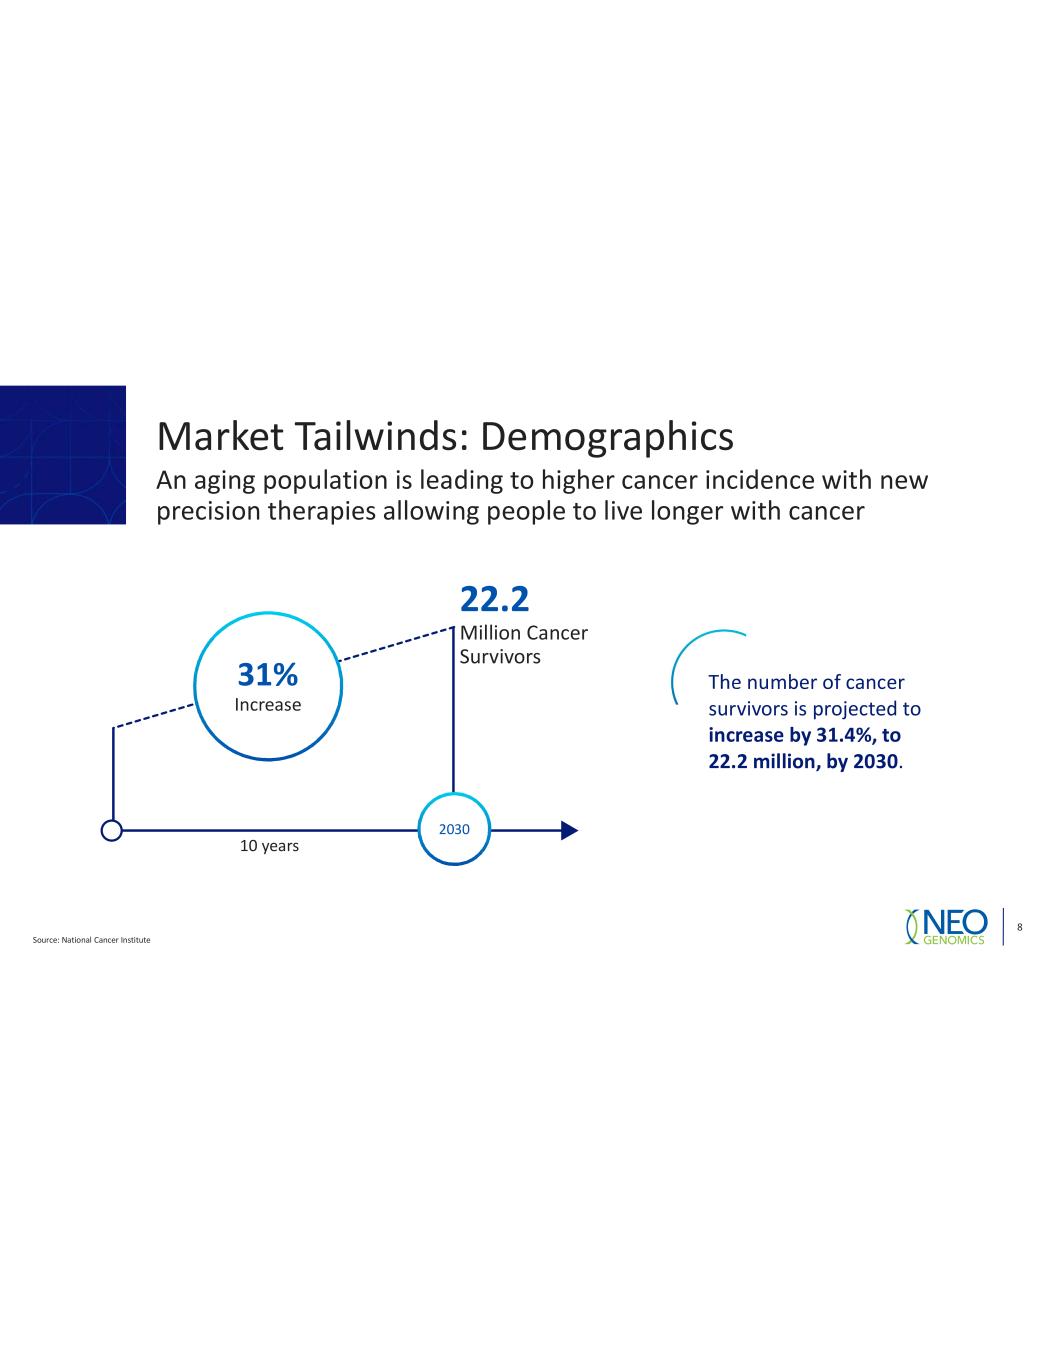
22.2 31% increase by 31.4%, to 22.2 million, by 2030
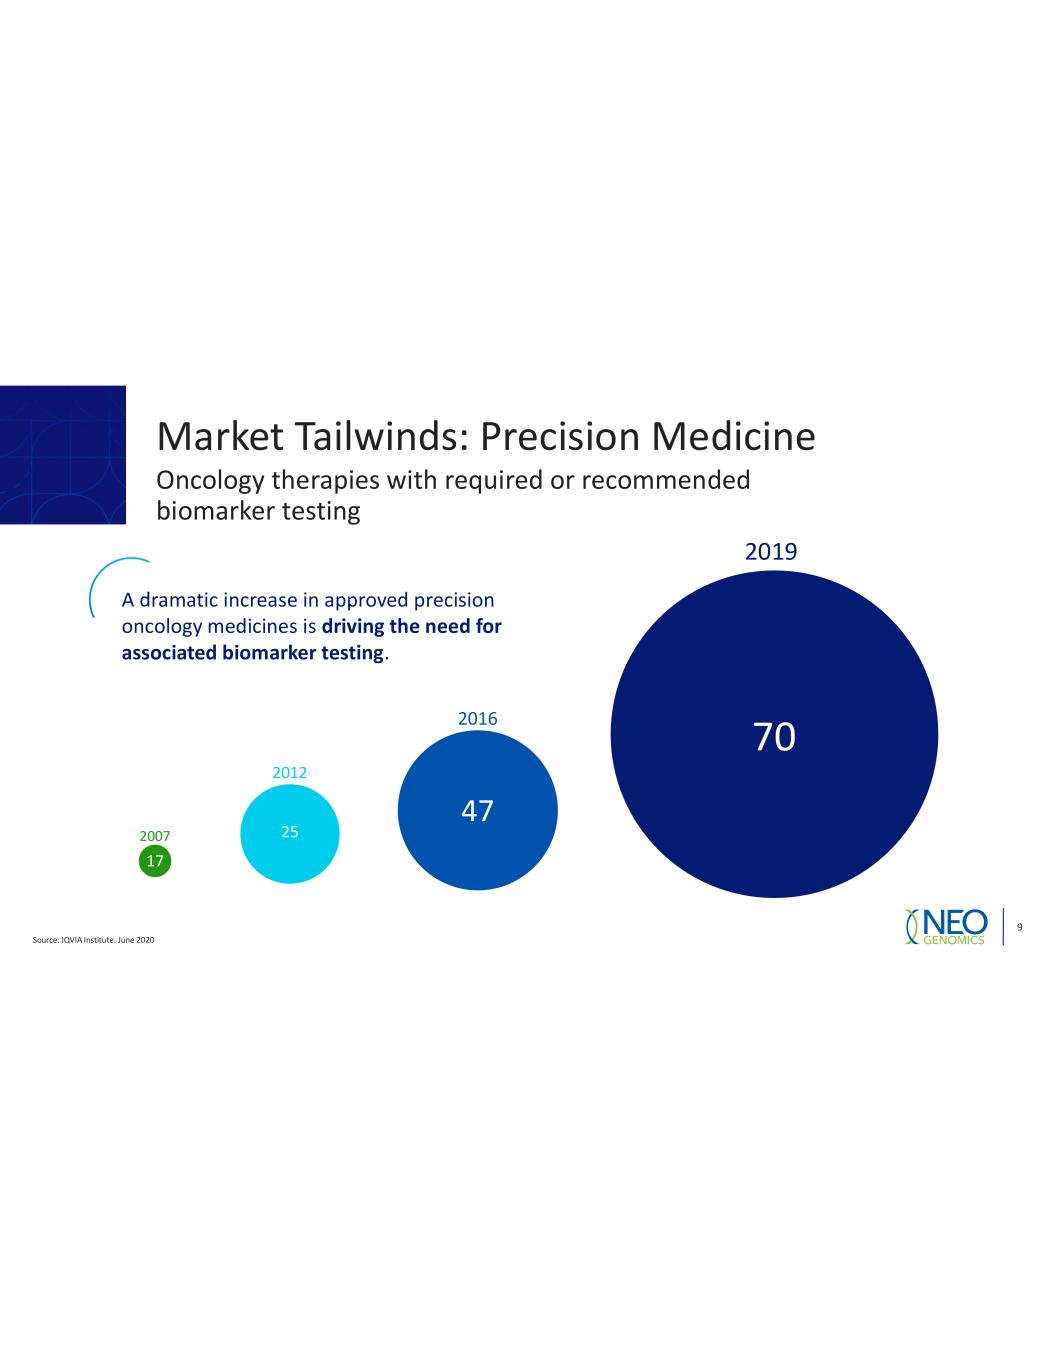
driving the need for associated biomarker testing
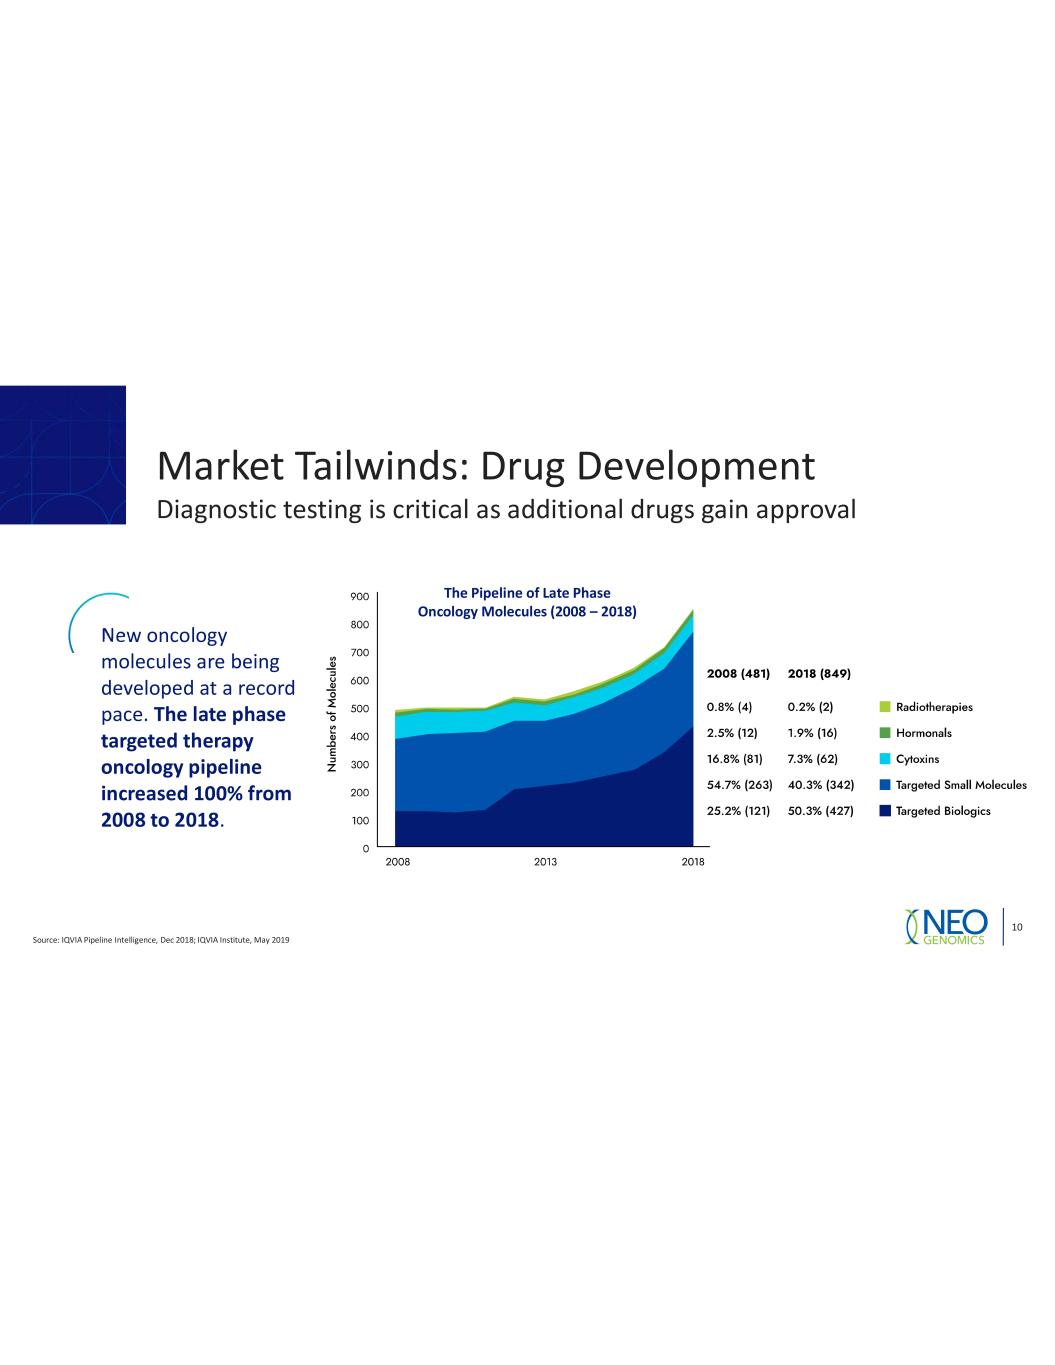
The late phase targeted therapy oncology pipeline increased 100% from 2008 to 2018 The Pipeline of Late Phase Oncology Molecules (2008 – 2018)
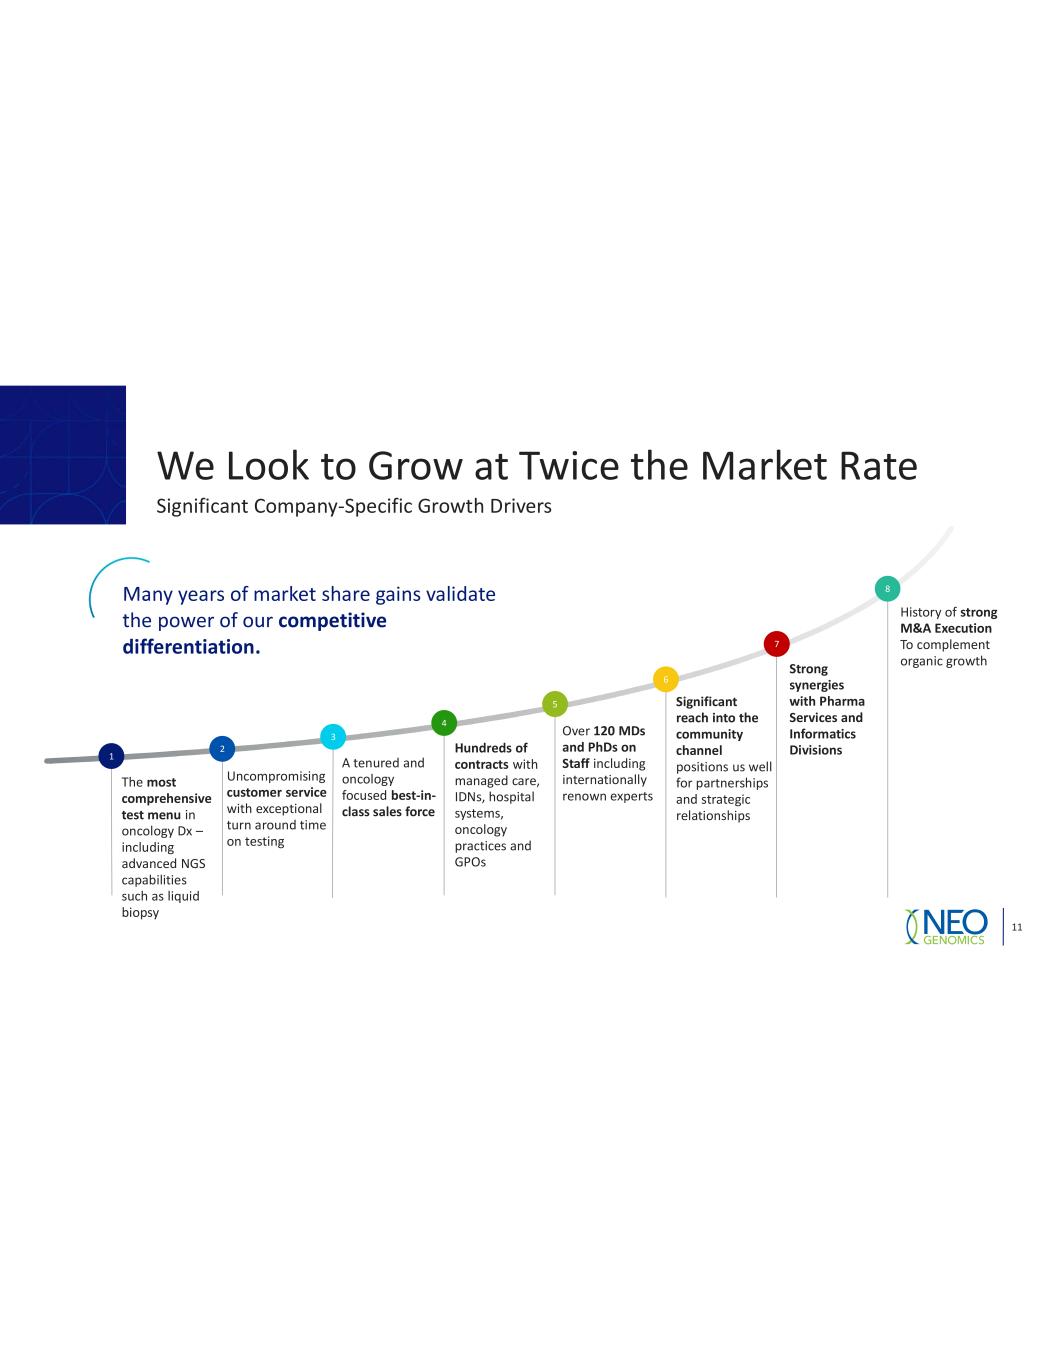
most comprehensive test menu customer service 120 MDs and PhDs on Staff competitive differentiation. Strong synergies with Pharma Services and Informatics Divisions best-in- class sales force Hundreds of contracts strong M&A Execution Significant reach into the community channel
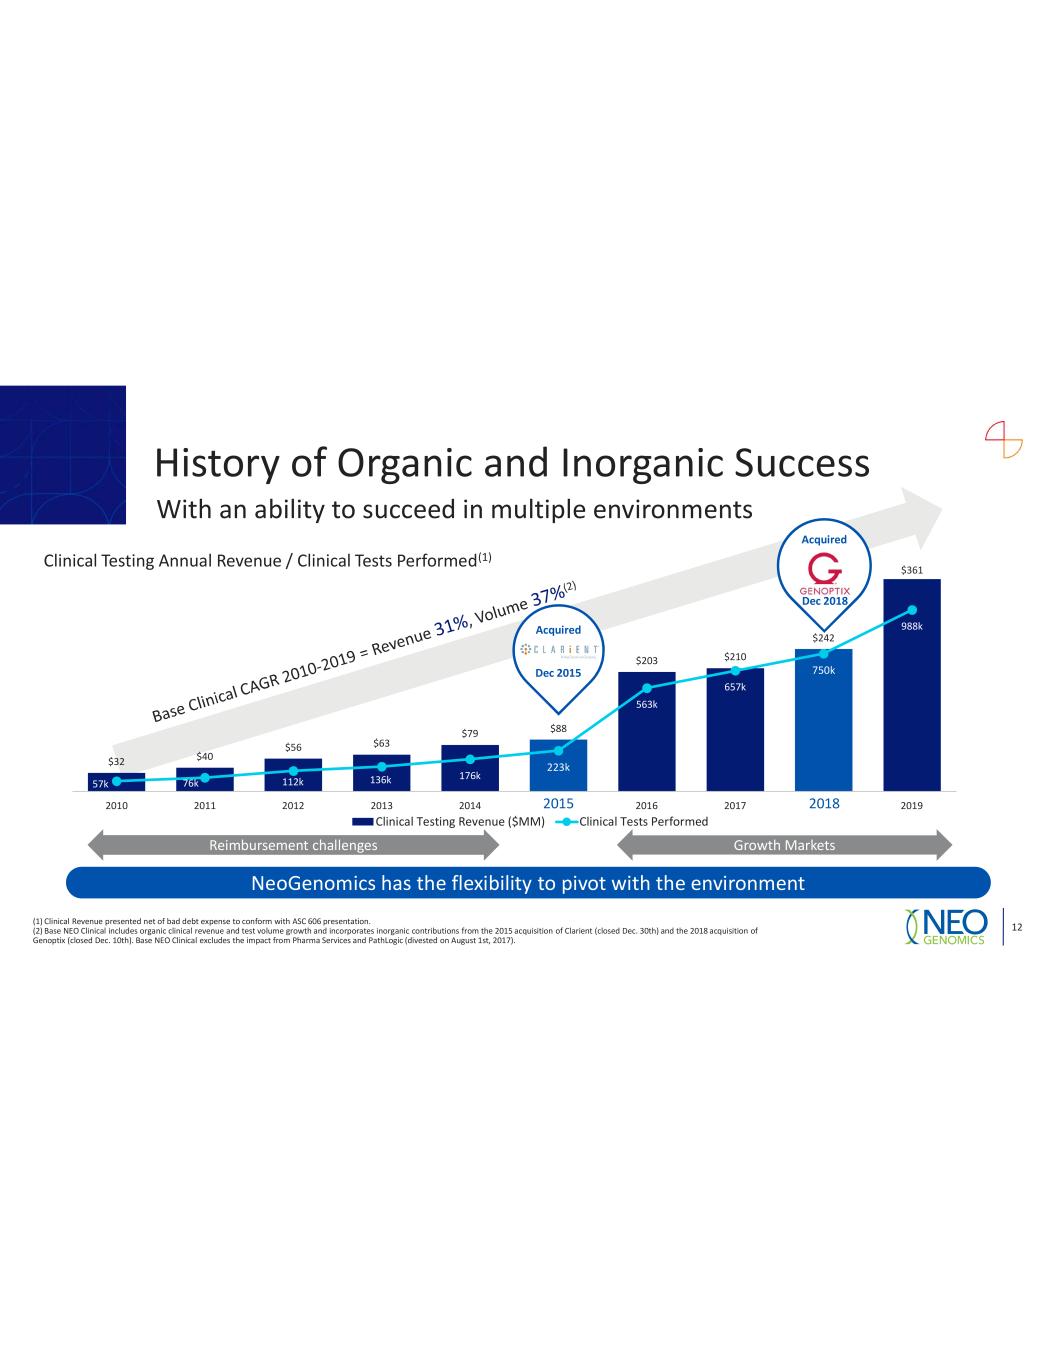
Acquired Acquired Dec 2015 Dec 2018
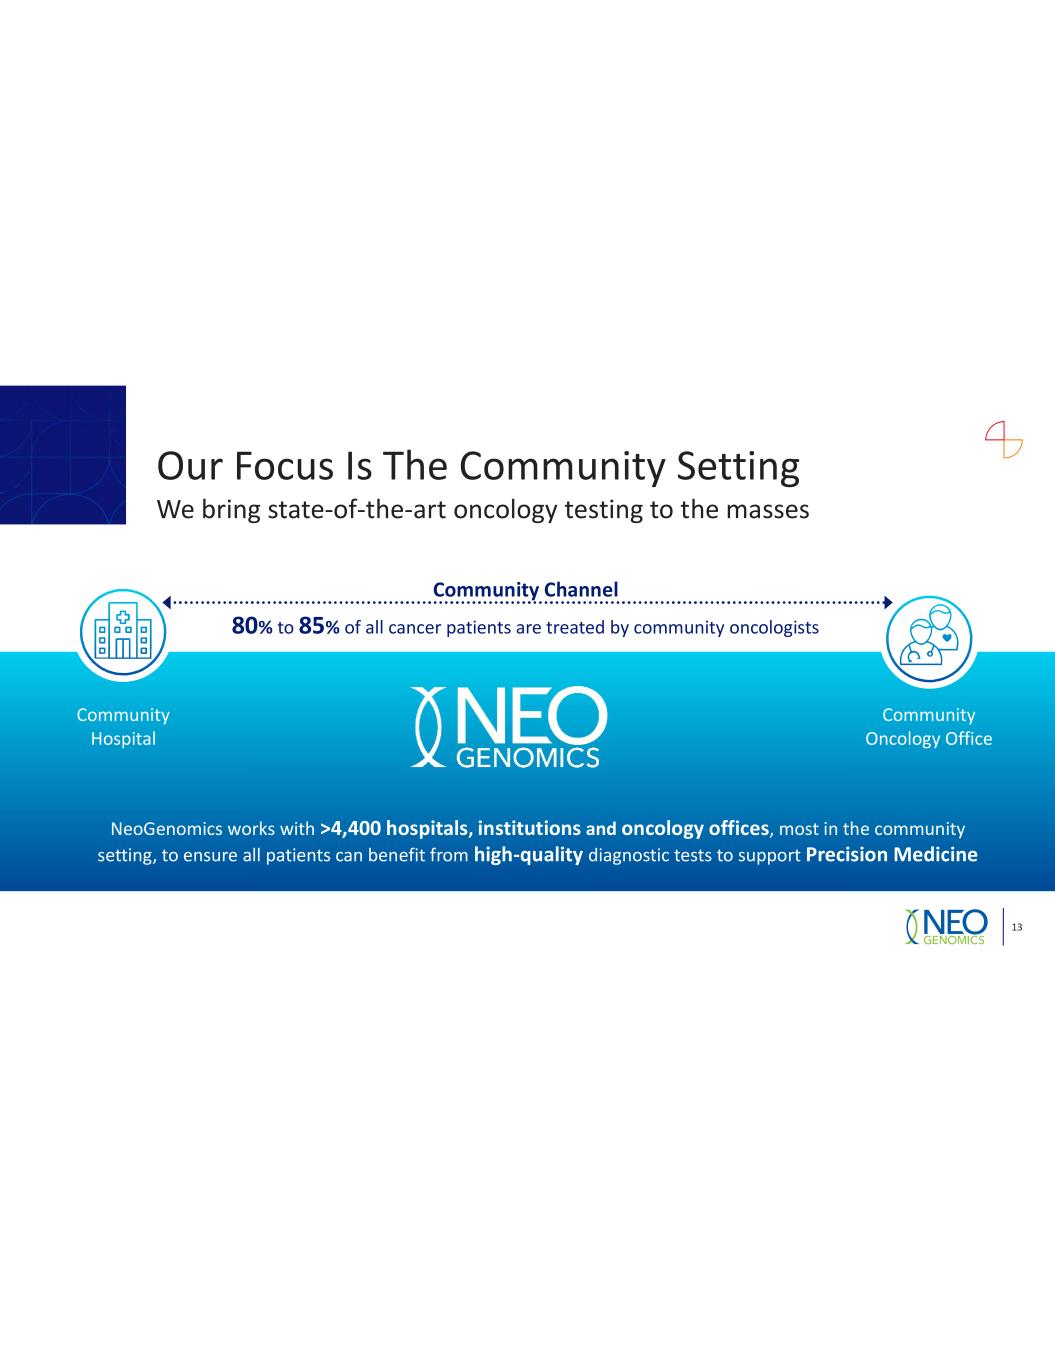
>4,400 hospitals, institutions and oncology offices high-quality Precision Medicine Community Channel 80% 85%
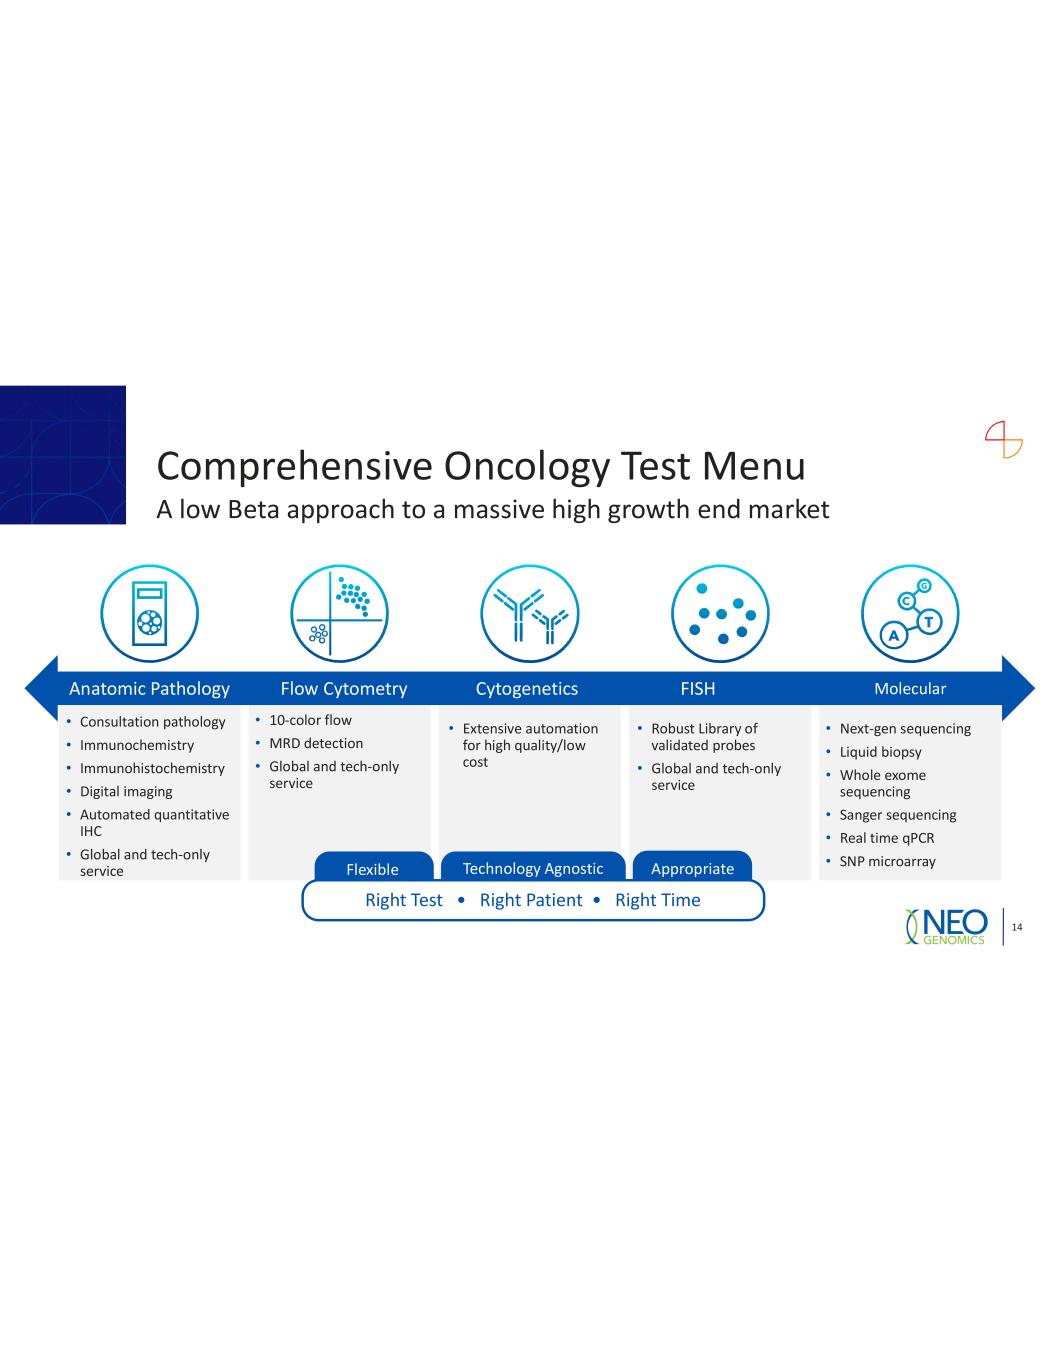
• • • • • • • • • • • • • • • • • •
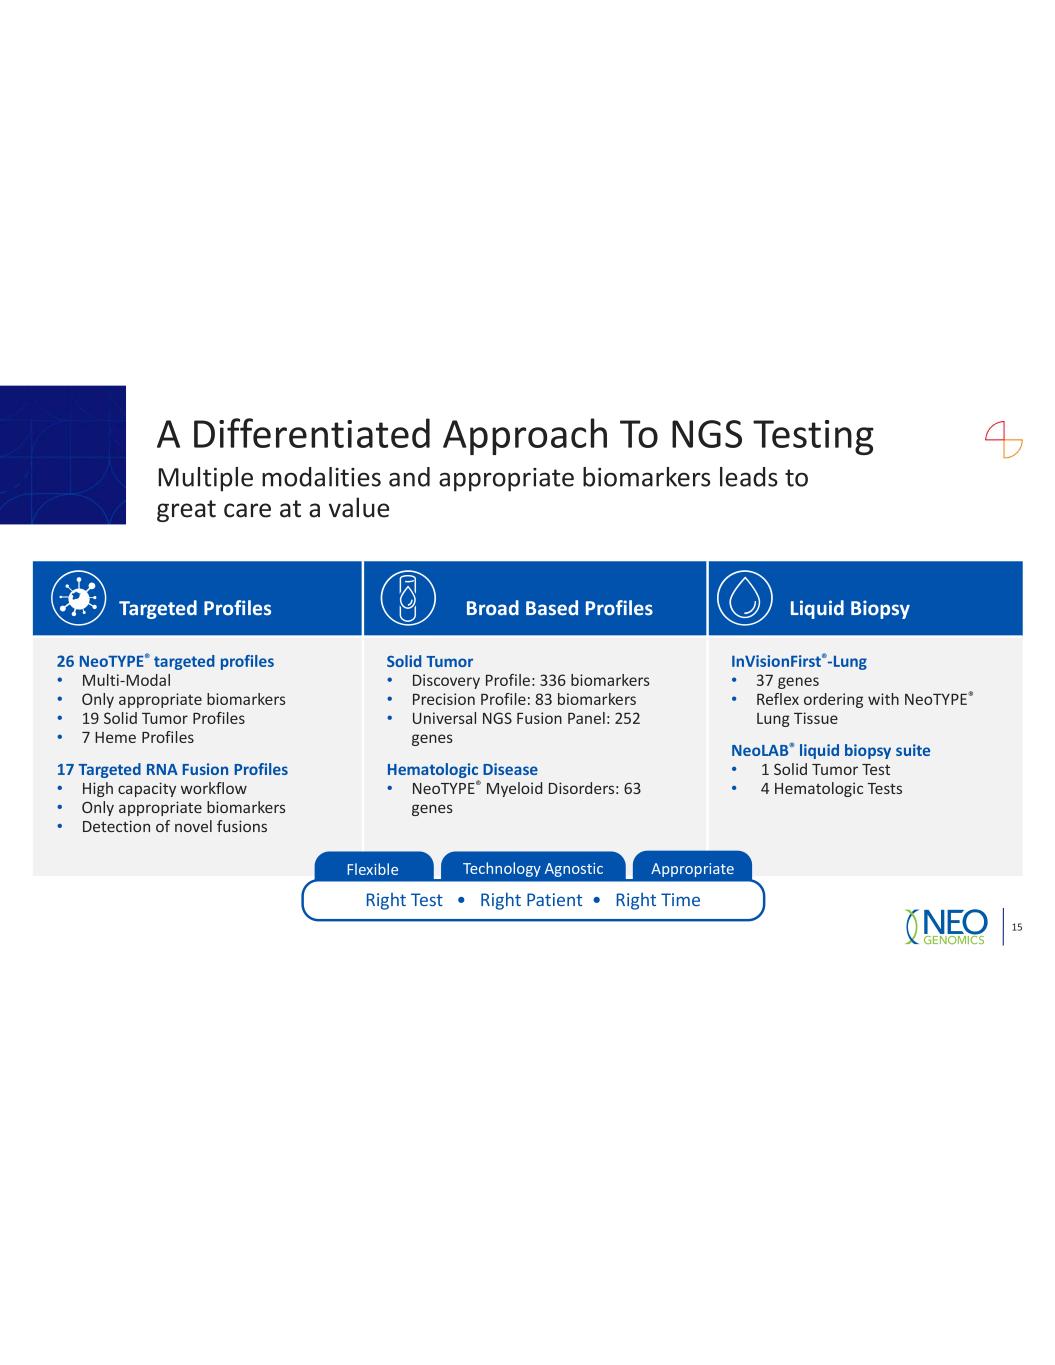
Targeted Profiles Broad Based Profiles Liquid Biopsy 26 NeoTYPE® targeted profiles • • • • 17 Targeted RNA Fusion Profiles • • • Solid Tumor • • • Hematologic Disease • InVisionFirst®-Lung • • NeoLAB® liquid biopsy suite • •
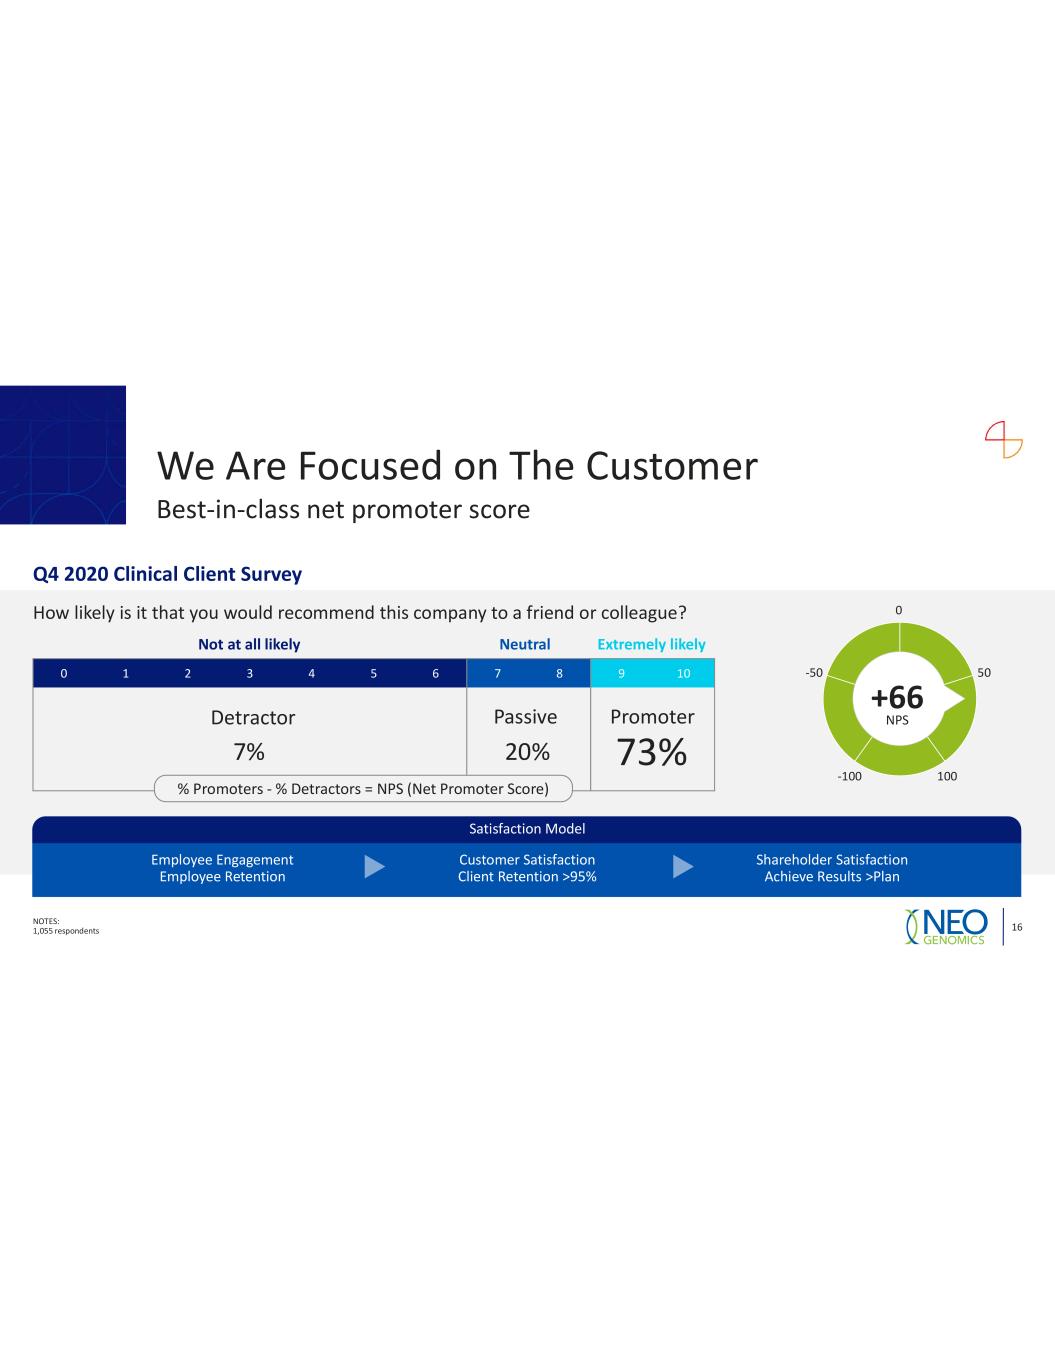
Q4 2020 Clinical Client Survey Not at all likely Neutral Extremely likely +66
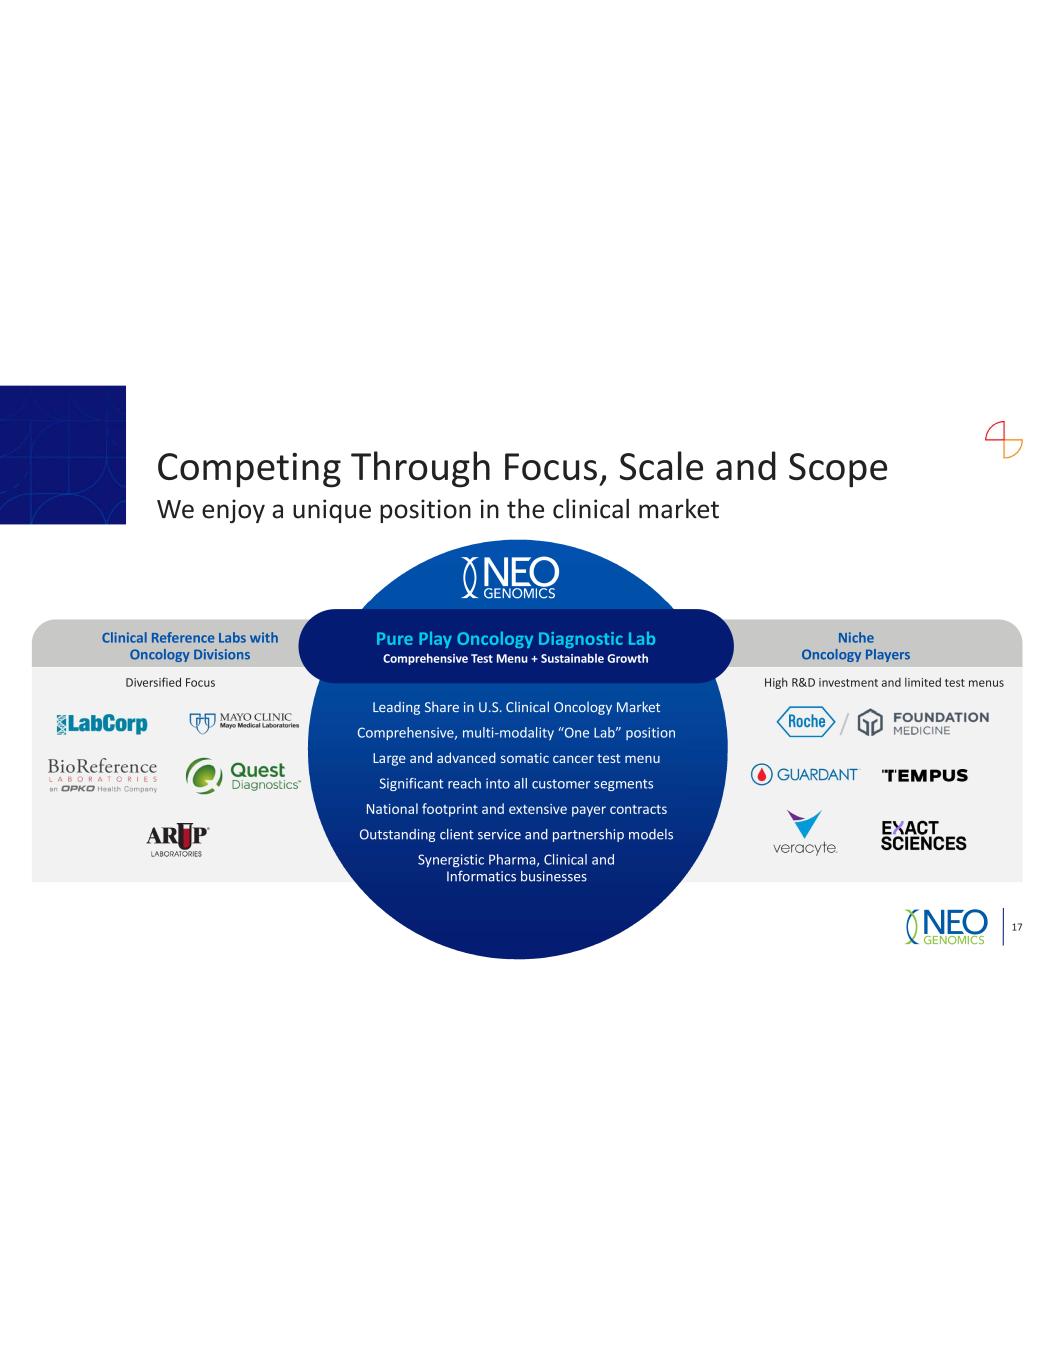
Clinical Reference Labs with Oncology Divisions Niche Oncology Players Pure Play Oncology Diagnostic Lab Comprehensive Test Menu + Sustainable Growth
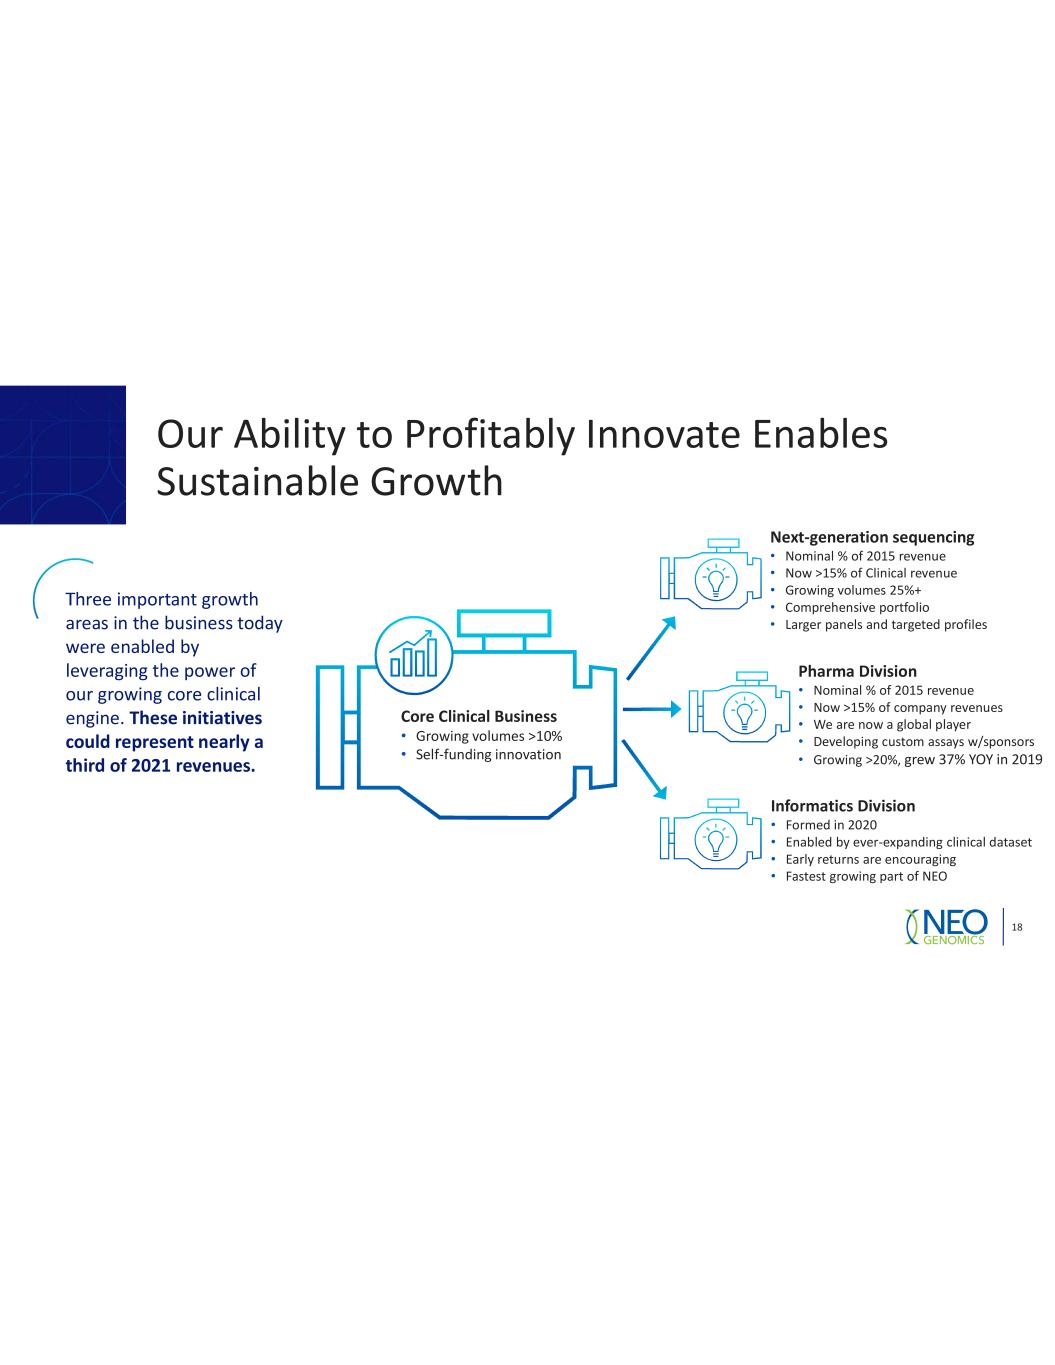
Core Clinical Business • • These initiatives could represent nearly a third of 2021 revenues. Next-generation sequencing • • • • • Pharma Division • • • • • Informatics Division • • • •
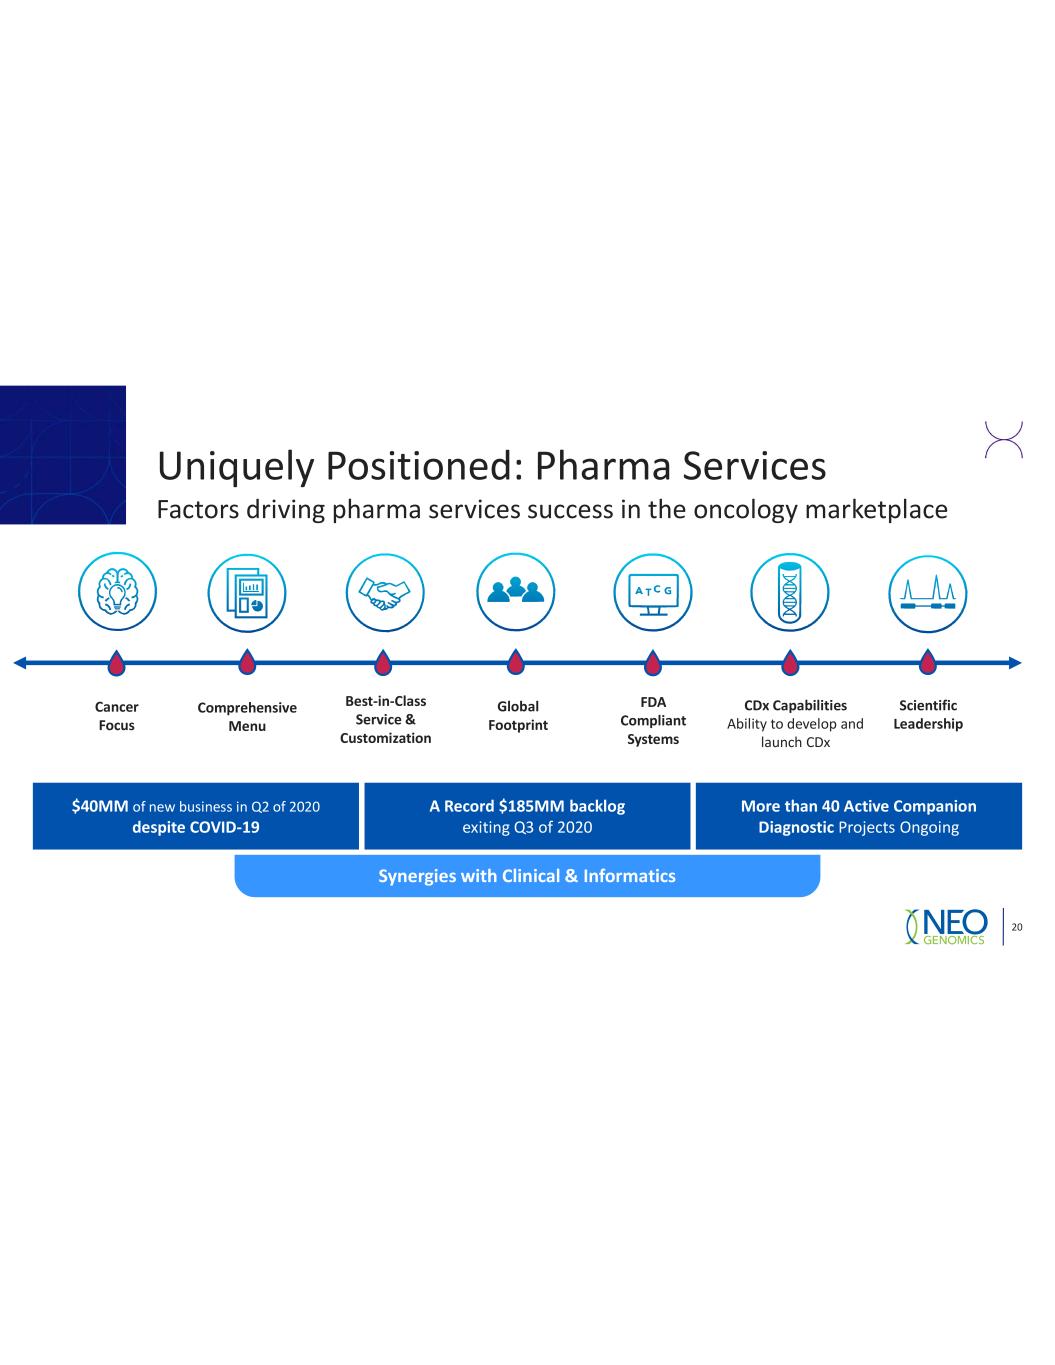
$40MM despite COVID-19 Synergies with Clinical & Informatics More than 40 Active Companion Diagnostic A Record $185MM backlog Comprehensive Menu Scientific Leadership CDx CapabilitiesBest-in-Class Service & Customization Cancer Focus Global Footprint FDA Compliant Systems
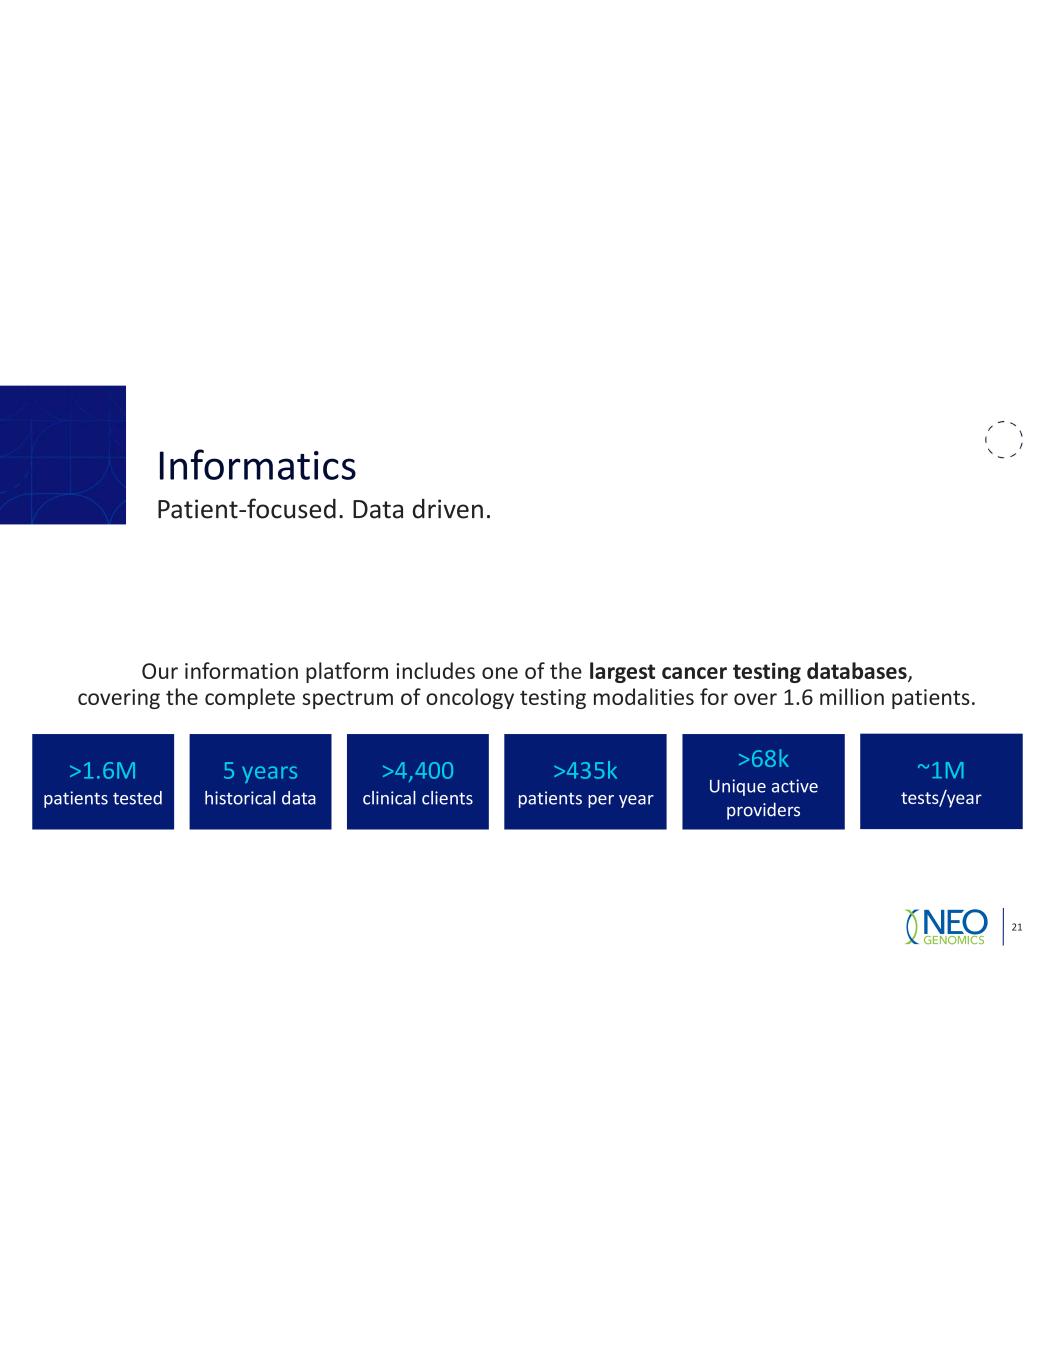
largest cancer testing databases
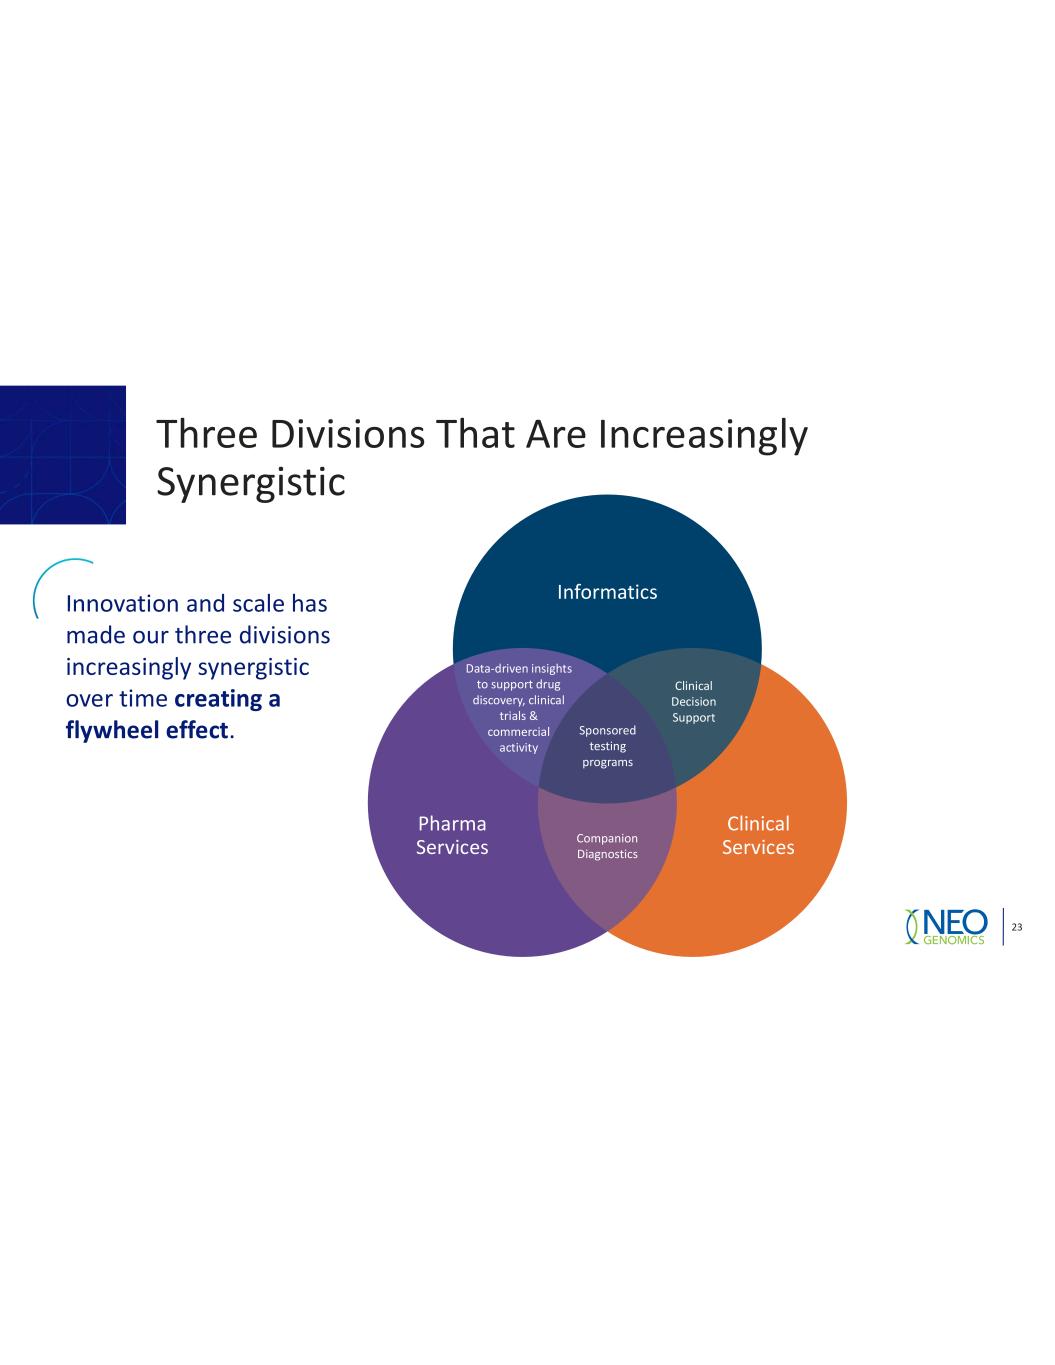
creating a flywheel effect
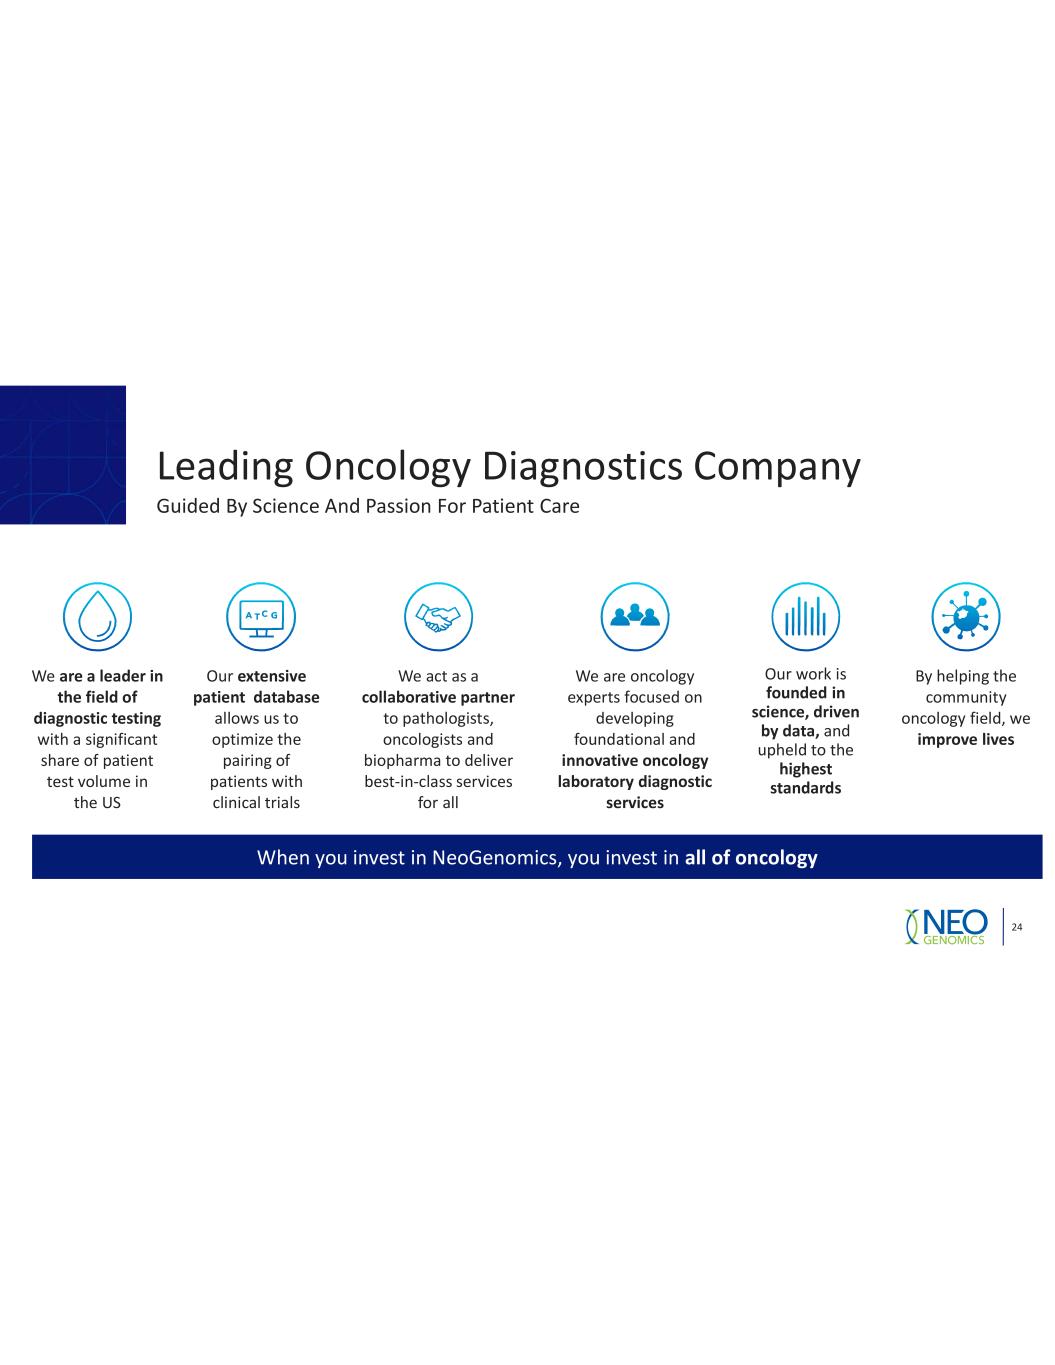
are a leader in the field of diagnostic testing extensive patient database collaborative partner improve lives founded in science, driven by data, highest standards innovative oncology laboratory diagnostic services all of oncology
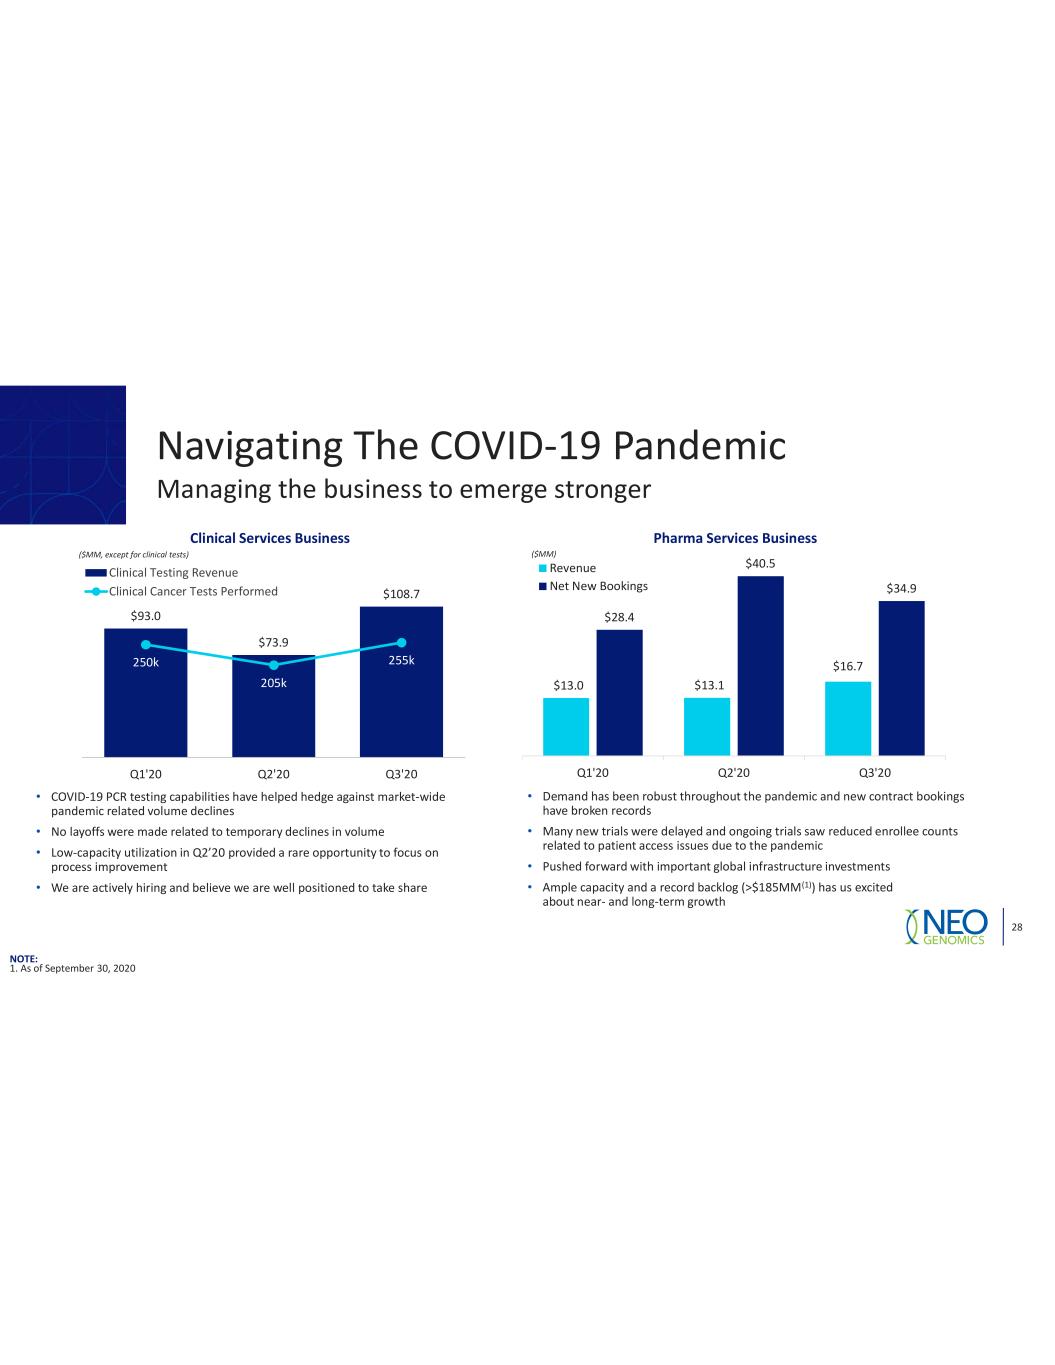
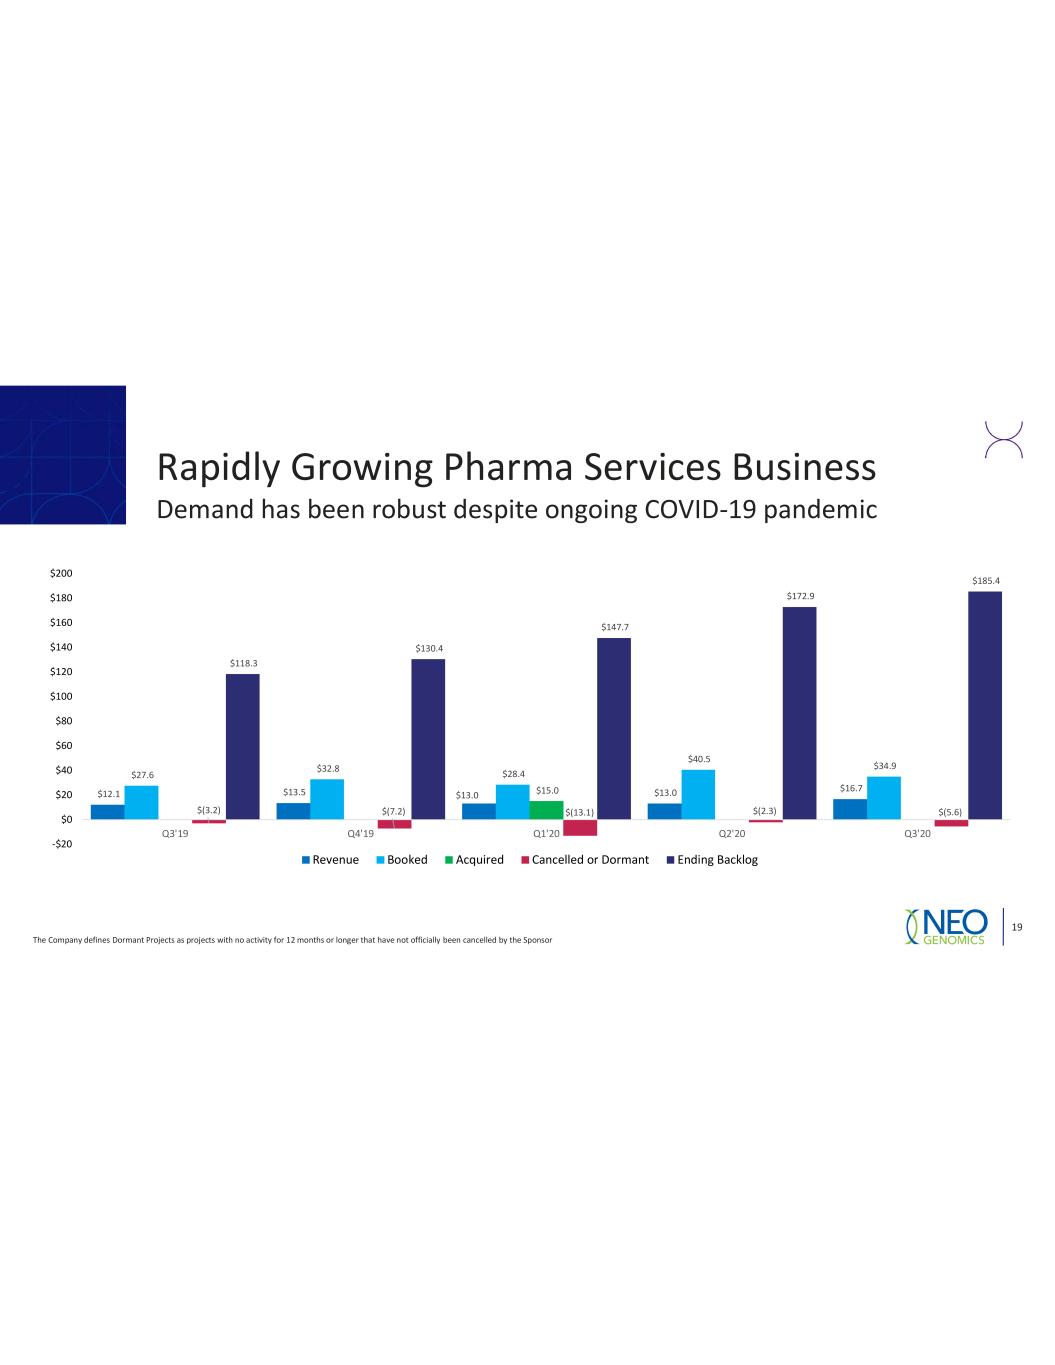
Clinical Services Business ($MM, except for clinical tests) Pharma Services Business ($MM) • • • • • • • • NOTE:
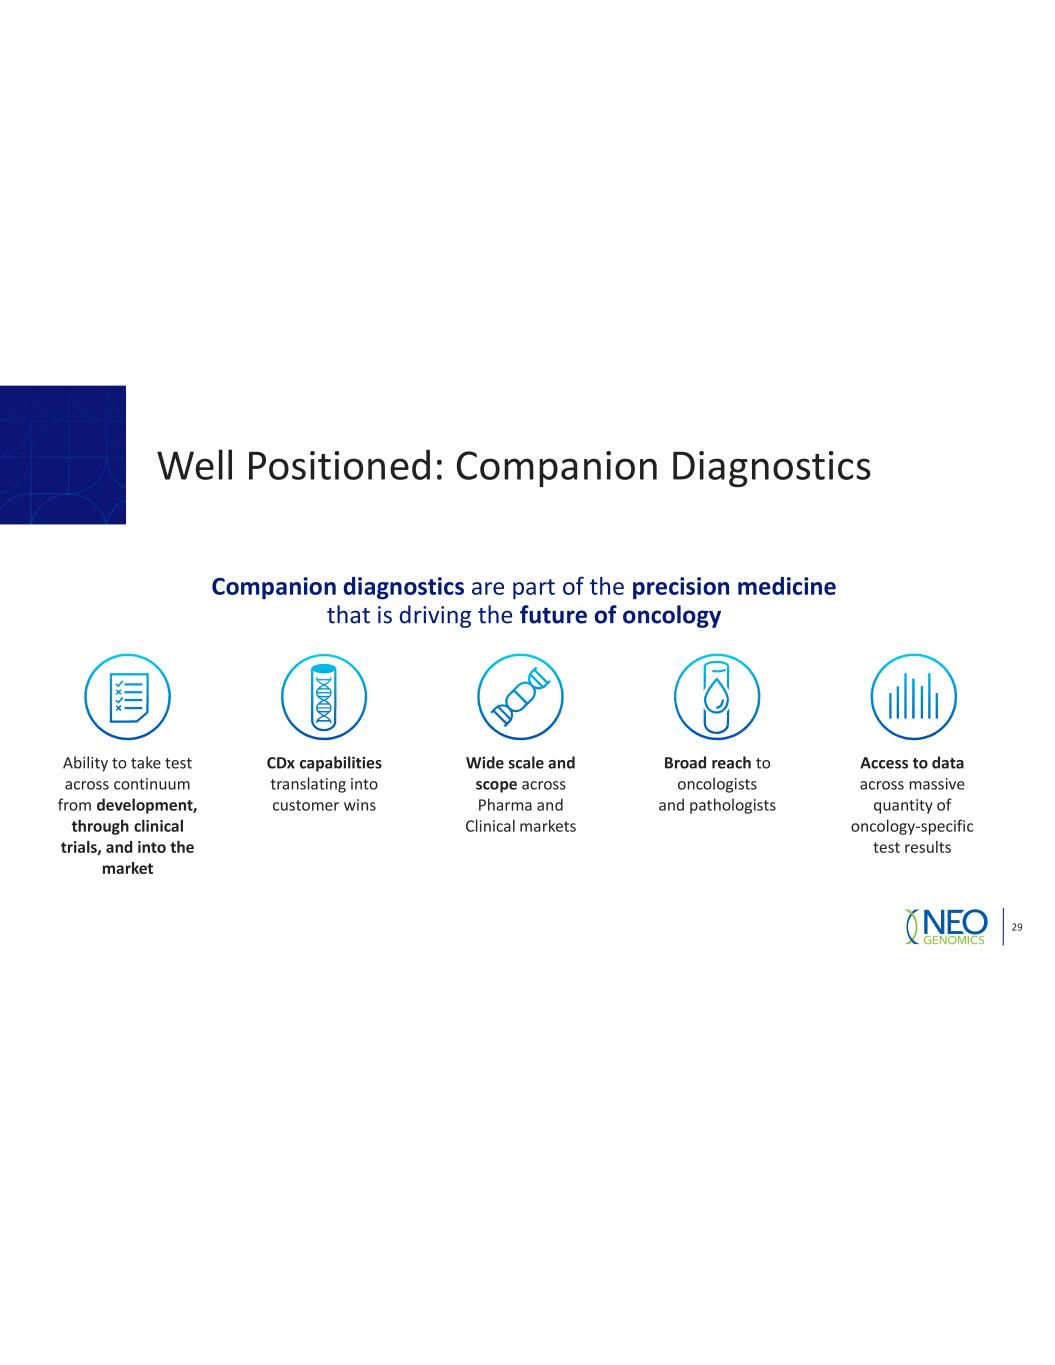
Companion diagnostics precision medicine future of oncology development, through clinical trials, and into the market CDx capabilities Wide scale and scope Broad reach Access to data
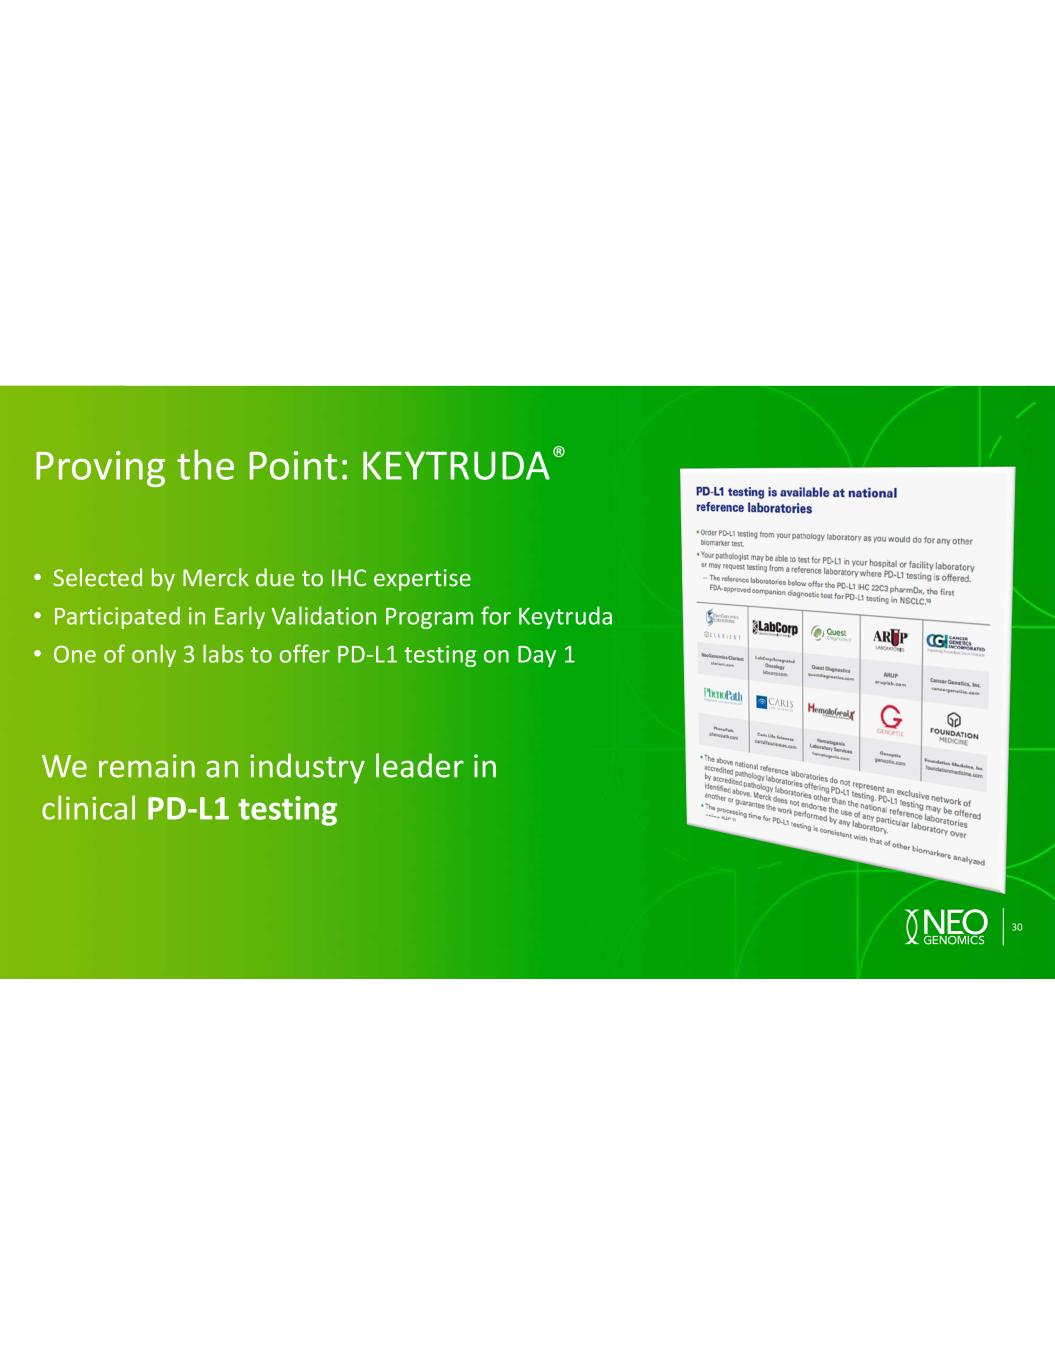
• • • PD-L1 testing
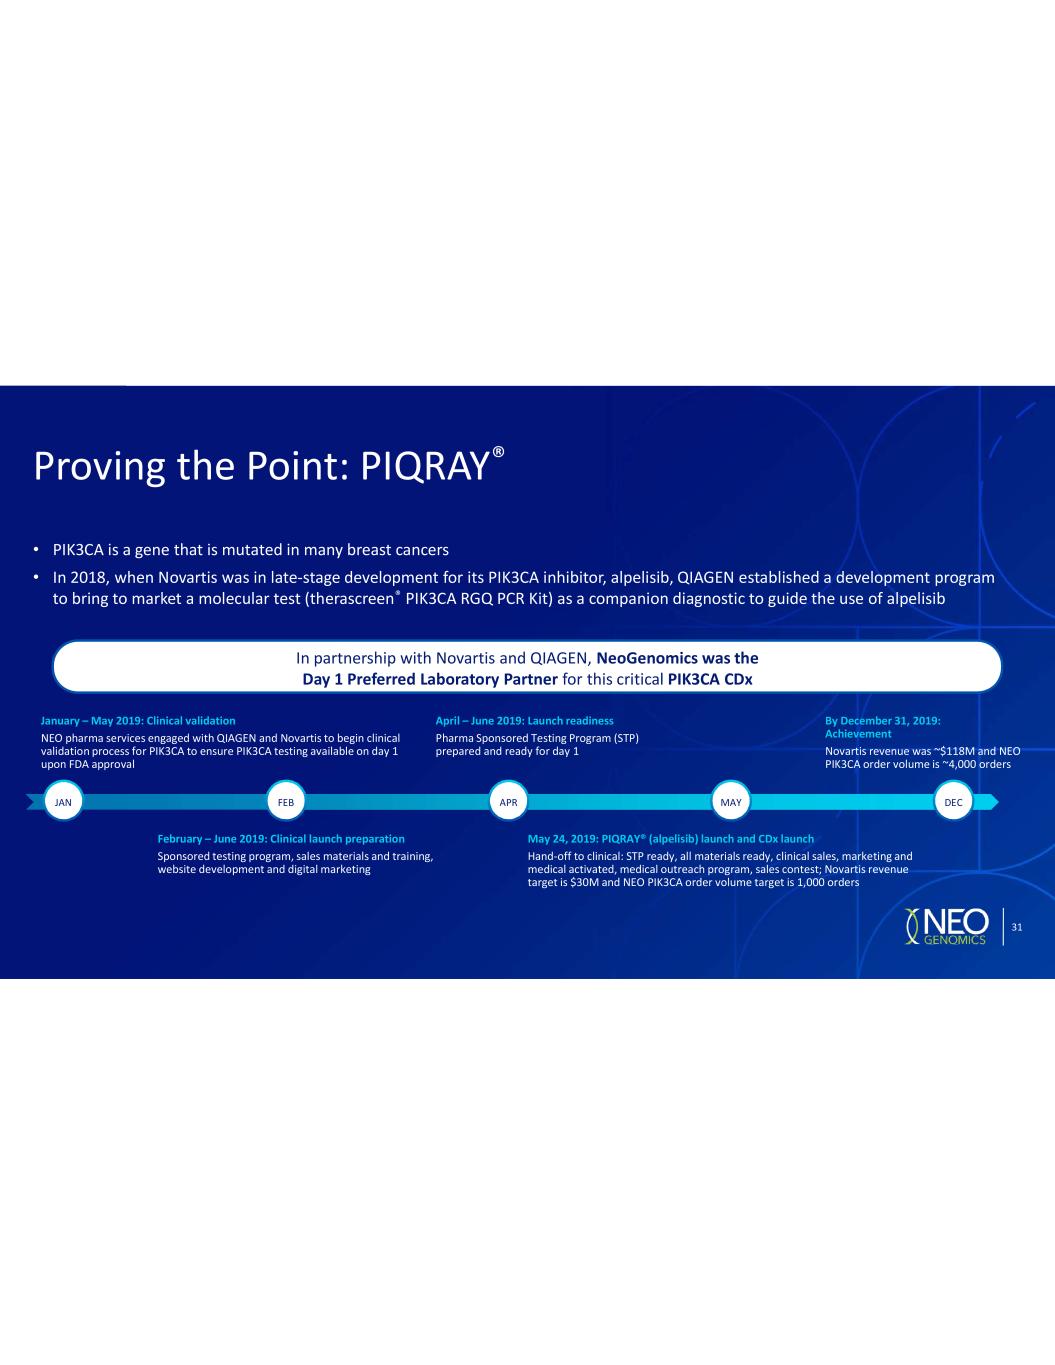
• • By December 31, 2019: Achievement May 24, 2019: PIQRAY® (alpelisib) launch and CDx launch April – June 2019: Launch readiness February – June 2019: Clinical launch preparation January – May 2019: Clinical validation NeoGenomics was the Day 1 Preferred Laboratory Partner PIK3CA CDx
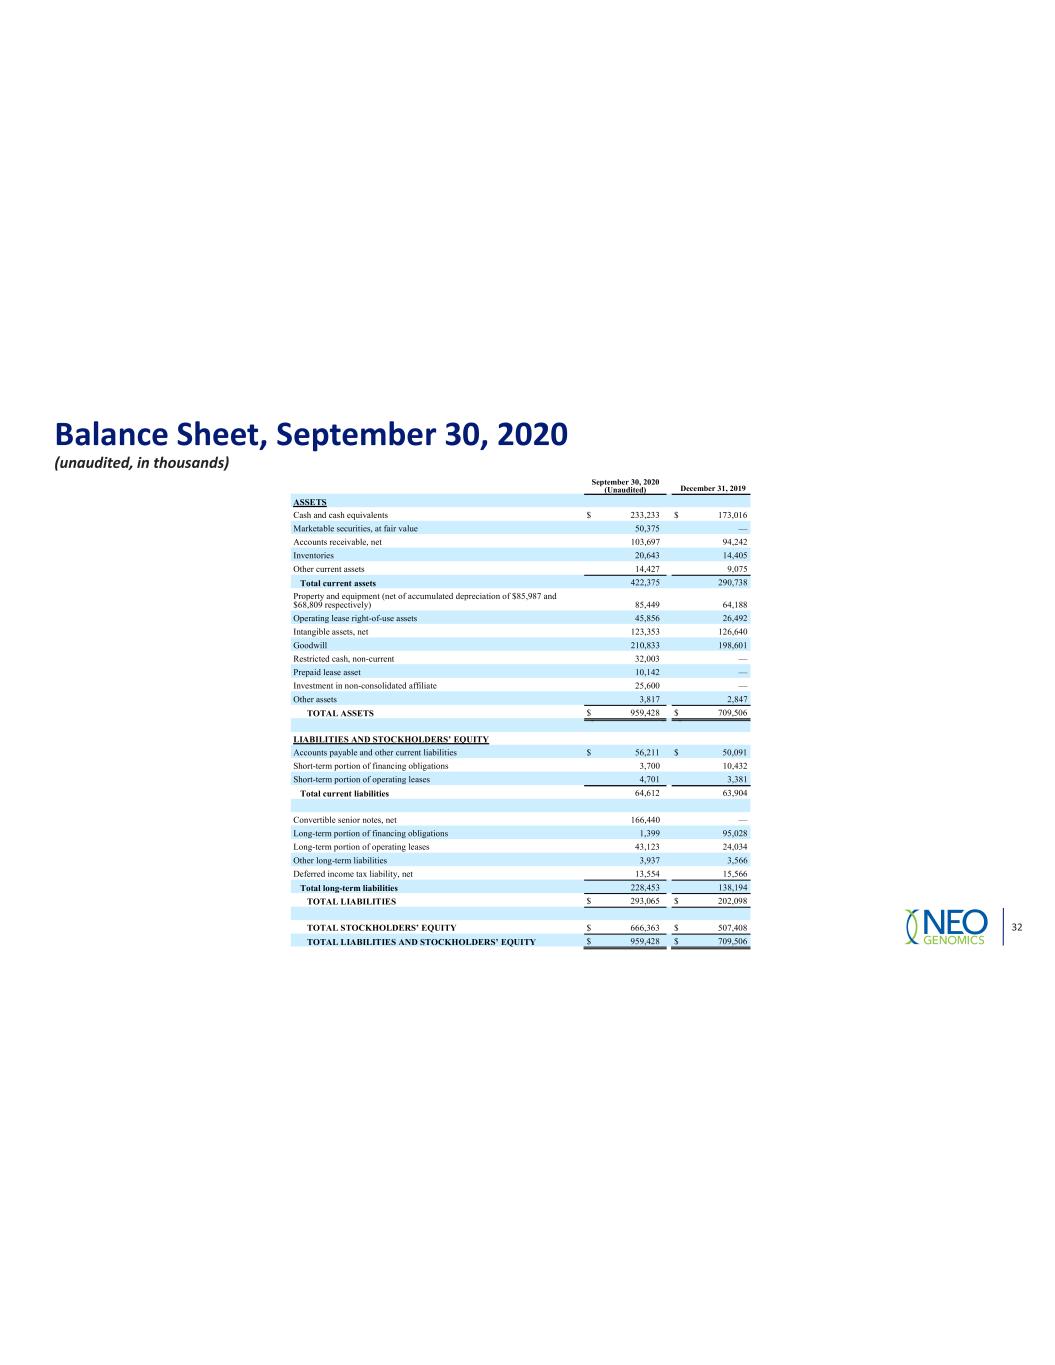
Balance Sheet, September 30, 2020 (unaudited, in thousands) September 30, 2020 (Unaudited) December 31, 2019 ASSETS Cash and cash equivalents $ 233,233 $ 173,016 Marketable securities, at fair value 50,375 — Accounts receivable, net 103,697 94,242 Inventories 20,643 14,405 Other current assets 14,427 9,075 Total current assets 422,375 290,738 Property and equipment (net of accumulated depreciation of $85,987 and $68,809 respectively) 85,449 64,188 Operating lease right-of-use assets 45,856 26,492 Intangible assets, net 123,353 126,640 Goodwill 210,833 198,601 Restricted cash, non-current 32,003 — Prepaid lease asset 10,142 — Investment in non-consolidated affiliate 25,600 — Other assets 3,817 2,847 TOTAL ASSETS $ 959,428 $ 709,506 LIABILITIES AND STOCKHOLDERS’ EQUITY Accounts payable and other current liabilities $ 56,211 $ 50,091 Short-term portion of financing obligations 3,700 10,432 Short-term portion of operating leases 4,701 3,381 Total current liabilities 64,612 63,904 Convertible senior notes, net 166,440 — Long-term portion of financing obligations 1,399 95,028 Long-term portion of operating leases 43,123 24,034 Other long-term liabilities 3,937 3,566 Deferred income tax liability, net 13,554 15,566 Total long-term liabilities 228,453 138,194 TOTAL LIABILITIES $ 293,065 $ 202,098 TOTAL STOCKHOLDERS’ EQUITY $ 666,363 $ 507,408 TOTAL LIABILITIES AND STOCKHOLDERS’ EQUITY $ 959,428 $ 709,506
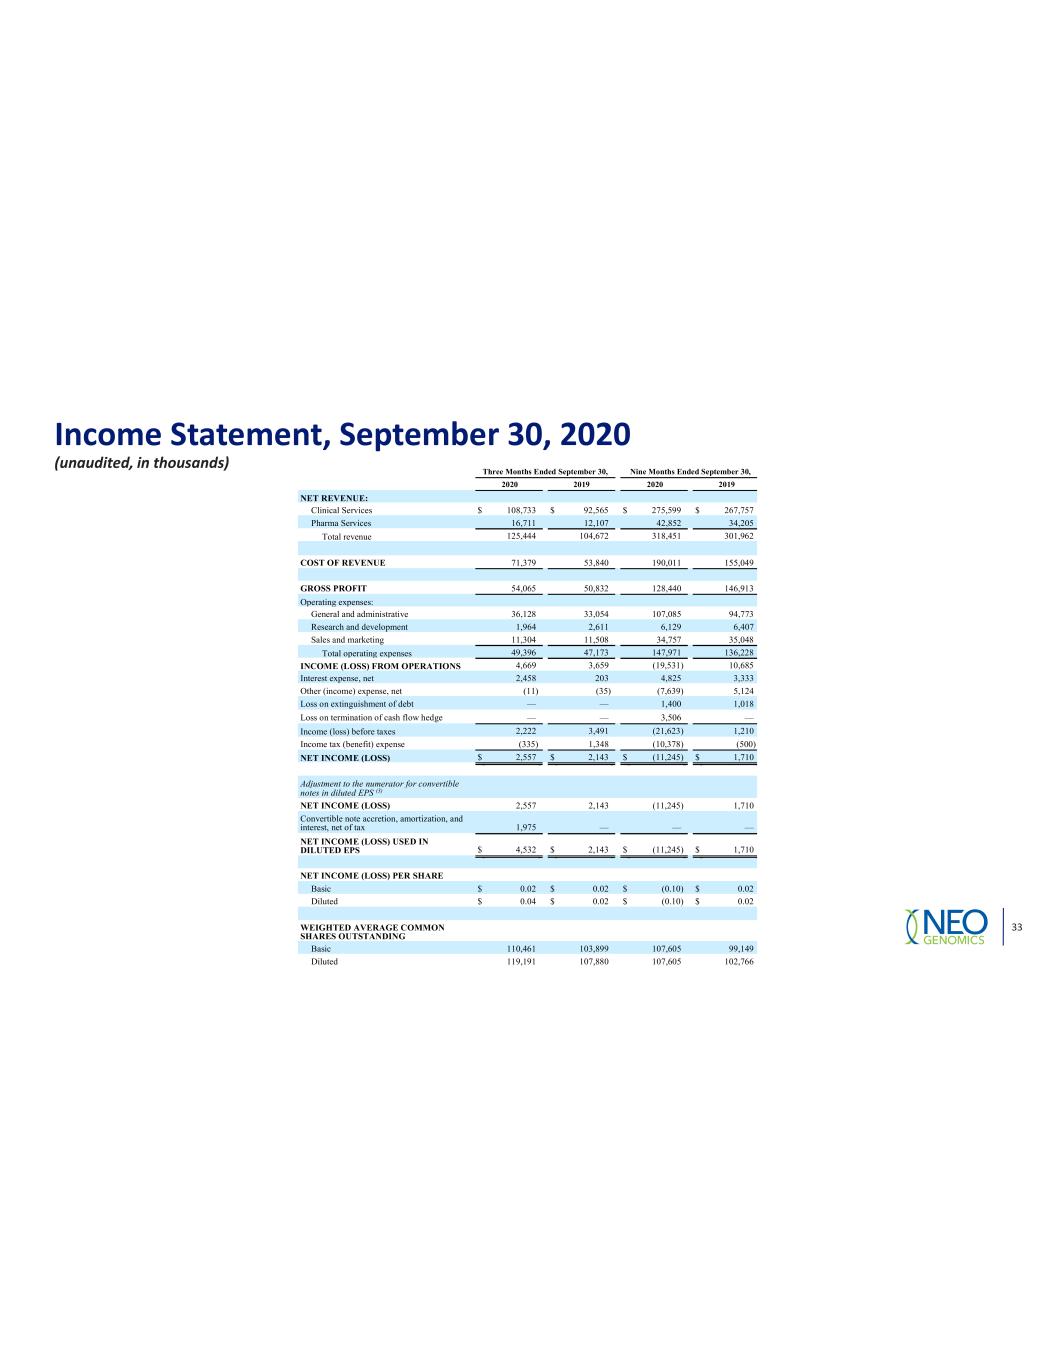
Income Statement, September 30, 2020 (unaudited, in thousands) Three Months Ended September 30, Nine Months Ended September 30, 2020 2019 2020 2019 NET REVENUE: Clinical Services $ 108,733 $ 92,565 $ 275,599 $ 267,757 Pharma Services 16,711 12,107 42,852 34,205 Total revenue 125,444 104,672 318,451 301,962 COST OF REVENUE 71,379 53,840 190,011 155,049 GROSS PROFIT 54,065 50,832 128,440 146,913 Operating expenses: General and administrative 36,128 33,054 107,085 94,773 Research and development 1,964 2,611 6,129 6,407 Sales and marketing 11,304 11,508 34,757 35,048 Total operating expenses 49,396 47,173 147,971 136,228 INCOME (LOSS) FROM OPERATIONS 4,669 3,659 (19,531) 10,685 Interest expense, net 2,458 203 4,825 3,333 Other (income) expense, net (11) (35) (7,639) 5,124 Loss on extinguishment of debt — — 1,400 1,018 Loss on termination of cash flow hedge — — 3,506 — Income (loss) before taxes 2,222 3,491 (21,623) 1,210 Income tax (benefit) expense (335) 1,348 (10,378) (500) NET INCOME (LOSS) $ 2,557 $ 2,143 $ (11,245) $ 1,710 Adjustment to the numerator for convertible notes in diluted EPS (3) NET INCOME (LOSS) 2,557 2,143 (11,245) 1,710 Convertible note accretion, amortization, and interest, net of tax 1,975 — — — NET INCOME (LOSS) USED IN DILUTED EPS $ 4,532 $ 2,143 $ (11,245) $ 1,710 NET INCOME (LOSS) PER SHARE Basic $ 0.02 $ 0.02 $ (0.10) $ 0.02 Diluted $ 0.04 $ 0.02 $ (0.10) $ 0.02 WEIGHTED AVERAGE COMMON SHARES OUTSTANDING Basic 110,461 103,899 107,605 99,149 Diluted 119,191 107,880 107,605 102,766
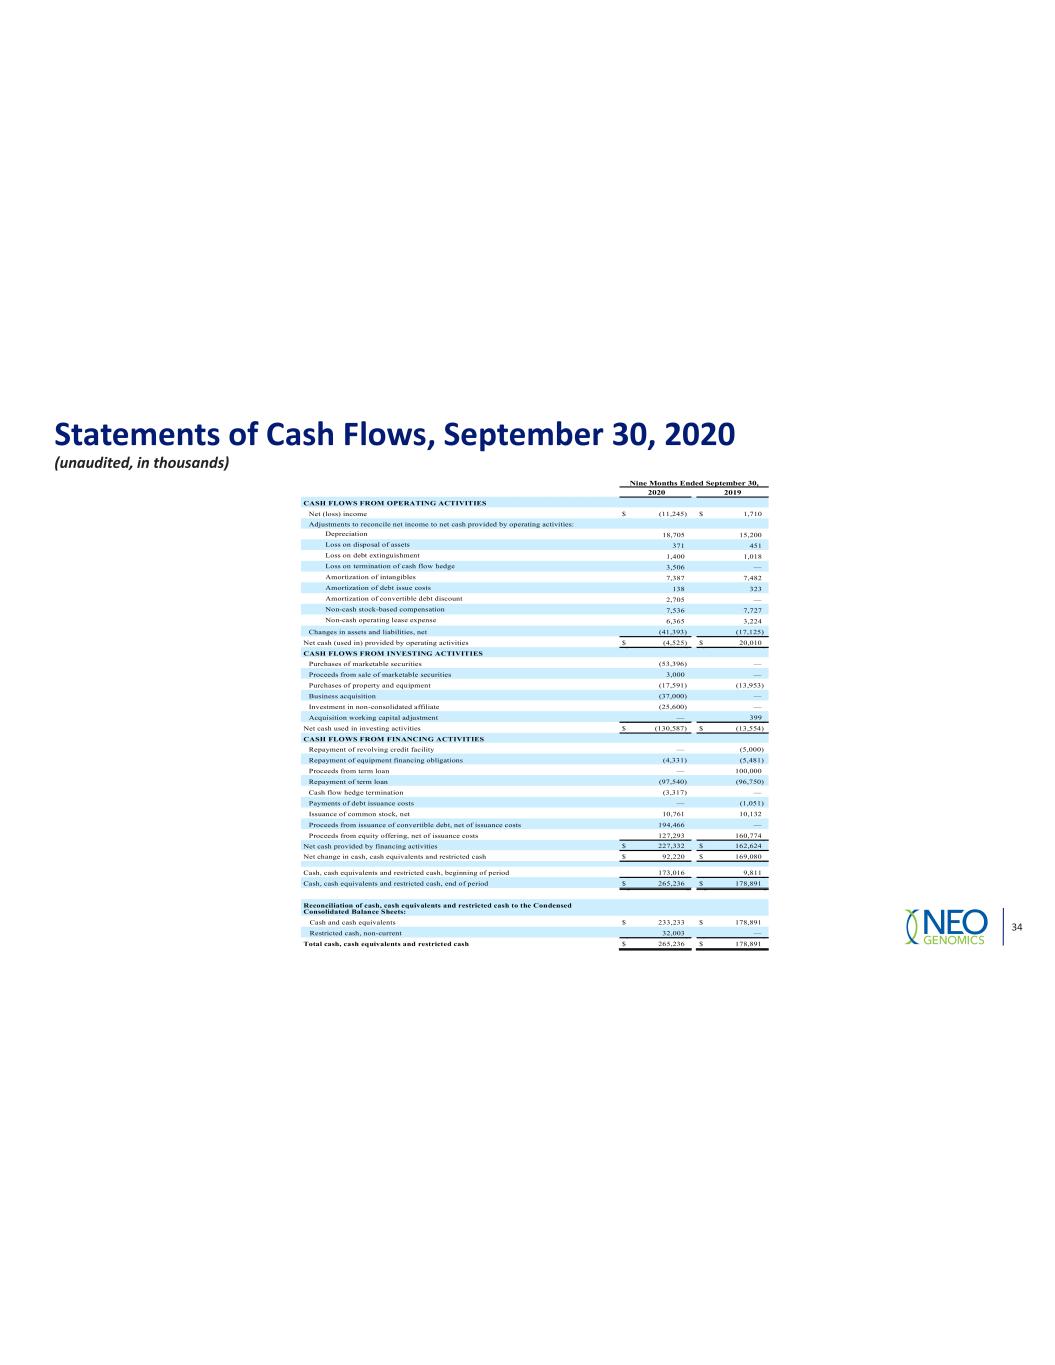
Statements of Cash Flows, September 30, 2020 (unaudited, in thousands) Nine Months Ended September 30, 2020 2019 CASH FLOWS FROM OPERATING ACTIVITIES Net (loss) income $ (11,245) $ 1,710 Adjustments to reconcile net income to net cash provided by operating activities: Depreciation 18,705 15,200 Loss on disposal of assets 371 451 Loss on debt extinguishment 1,400 1,018 Loss on termination of cash flow hedge 3,506 — Amortization of intangibles 7,387 7,482 Amortization of debt issue costs 138 323 Amortization of convertible debt discount 2,705 — Non-cash stock-based compensation 7,536 7,727 Non-cash operating lease expense 6,365 3,224 Changes in assets and liabilities, net (41,393) (17,125) Net cash (used in) provided by operating activities $ (4,525) $ 20,010 CASH FLOWS FROM INVESTING ACTIVITIES Purchases of marketable securities (53,396) — Proceeds from sale of marketable securities 3,000 — Purchases of property and equipment (17,591) (13,953) Business acquisition (37,000) — Investment in non-consolidated affiliate (25,600) — Acquisition working capital adjustment — 399 Net cash used in investing activities $ (130,587) $ (13,554) CASH FLOWS FROM FINANCING ACTIVITIES Repayment of revolving credit facility — (5,000) Repayment of equipment financing obligations (4,331) (5,481) Proceeds from term loan — 100,000 Repayment of term loan (97,540) (96,750) Cash flow hedge termination (3,317) — Payments of debt issuance costs — (1,051) Issuance of common stock, net 10,761 10,132 Proceeds from issuance of convertible debt, net of issuance costs 194,466 — Proceeds from equity offering, net of issuance costs 127,293 160,774 Net cash provided by financing activities $ 227,332 $ 162,624 Net change in cash, cash equivalents and restricted cash $ 92,220 $ 169,080 Cash, cash equivalents and restricted cash, beginning of period 173,016 9,811 Cash, cash equivalents and restricted cash, end of period $ 265,236 $ 178,891 Reconciliation of cash, cash equivalents and restricted cash to the Condensed Consolidated Balance Sheets: Cash and cash equivalents $ 233,233 $ 178,891 Restricted cash, non-current 32,003 — Total cash, cash equivalents and restricted cash $ 265,236 $ 178,891
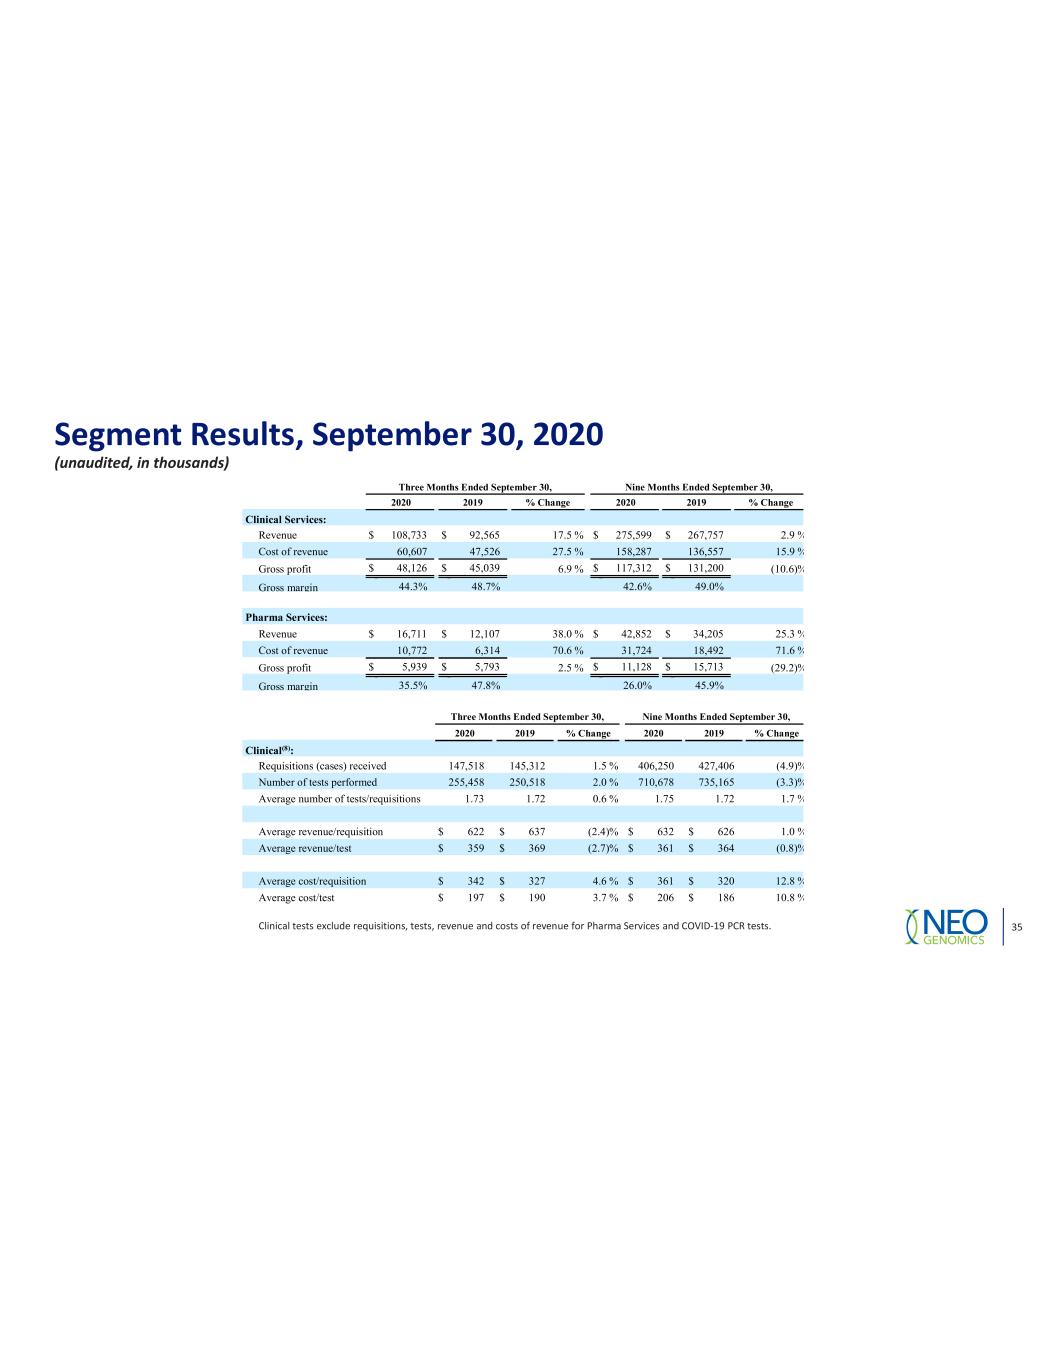
Segment Results, September 30, 2020 (unaudited, in thousands) Three Months Ended September 30, Nine Months Ended September 30, 2020 2019 % Change 2020 2019 % Change Clinical Services: Revenue $ 108,733 $ 92,565 17.5 % $ 275,599 $ 267,757 2.9 % Cost of revenue 60,607 47,526 27.5 % 158,287 136,557 15.9 % Gross profit $ 48,126 $ 45,039 6.9 % $ 117,312 $ 131,200 (10.6) % Gross margin 44.3% 48.7% 42.6% 49.0% Pharma Services: Revenue $ 16,711 $ 12,107 38.0 % $ 42,852 $ 34,205 25.3 % Cost of revenue 10,772 6,314 70.6 % 31,724 18,492 71.6 % Gross profit $ 5,939 $ 5,793 2.5 % $ 11,128 $ 15,713 (29.2) % Gross margin 35.5% 47.8% 26.0% 45.9% Three Months Ended September 30, Nine Months Ended September 30, 2020 2019 % Change 2020 2019 % Change Clinical(8): Requisitions (cases) received 147,518 145,312 1.5 % 406,250 427,406 (4.9) % Number of tests performed 255,458 250,518 2.0 % 710,678 735,165 (3.3) % Average number of tests/requisitions 1.73 1.72 0.6 % 1.75 1.72 1.7 % Average revenue/requisition $ 622 $ 637 (2.4) % $ 632 $ 626 1.0 % Average revenue/test $ 359 $ 369 (2.7) % $ 361 $ 364 (0.8) % Average cost/requisition $ 342 $ 327 4.6 % $ 361 $ 320 12.8 % Average cost/test $ 197 $ 190 3.7 % $ 206 $ 186 10.8 %
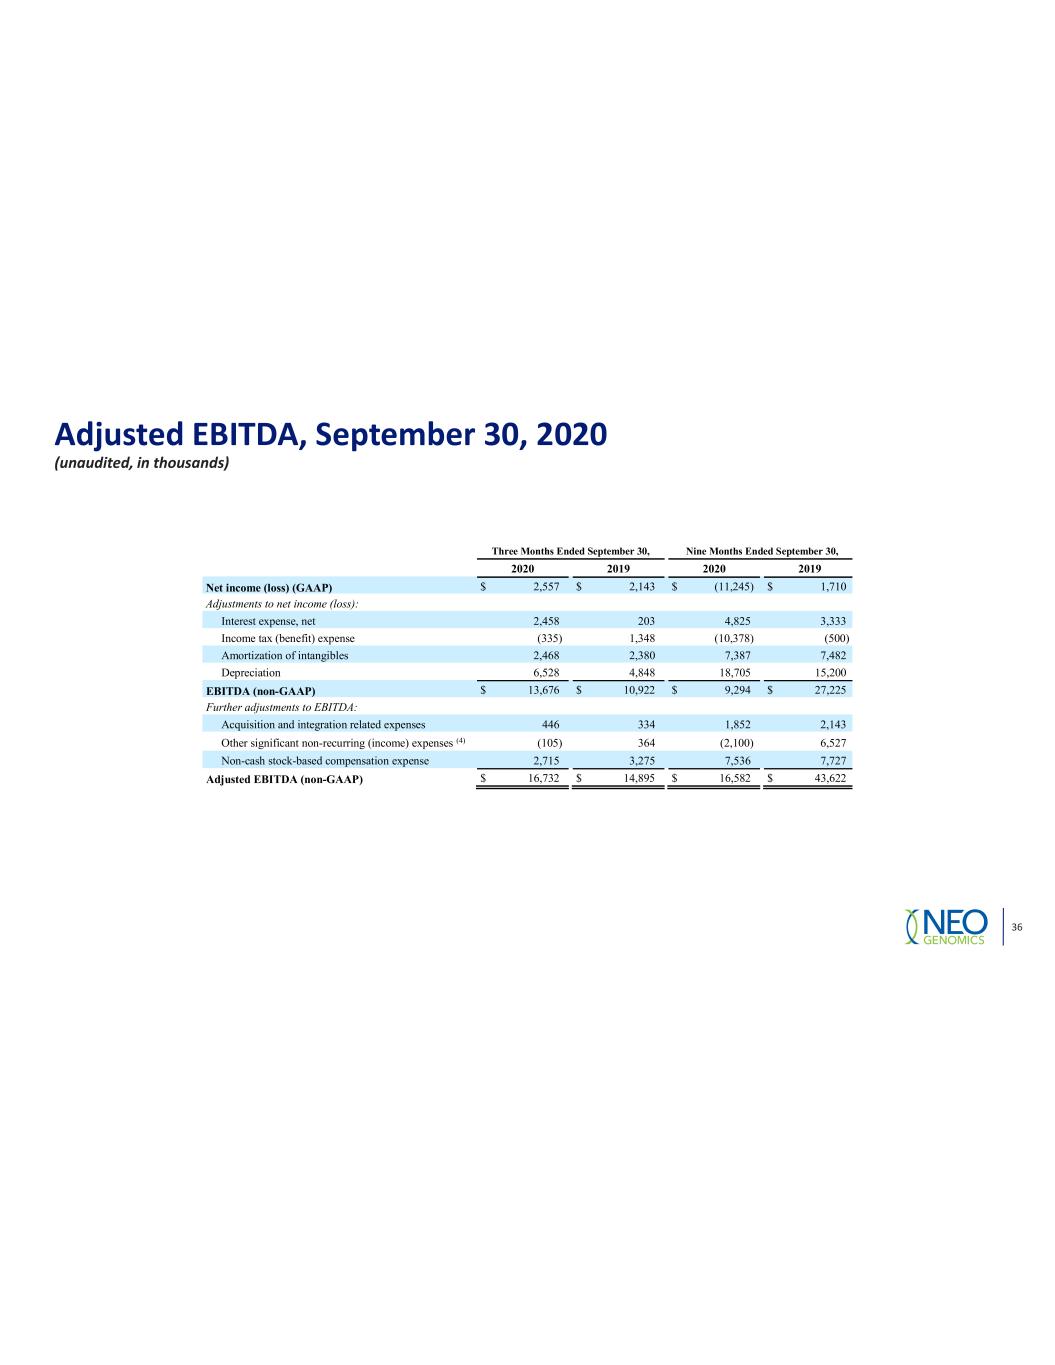
Adjusted EBITDA, September 30, 2020 (unaudited, in thousands) Three Months Ended September 30, Nine Months Ended September 30, 2020 2019 2020 2019 Net income (loss) (GAAP) $ 2,557 $ 2,143 $ (11,245) $ 1,710 Adjustments to net income (loss): Interest expense, net 2,458 203 4,825 3,333 Income tax (benefit) expense (335) 1,348 (10,378) (500) Amortization of intangibles 2,468 2,380 7,387 7,482 Depreciation 6,528 4,848 18,705 15,200 EBITDA (non-GAAP) $ 13,676 $ 10,922 $ 9,294 $ 27,225 Further adjustments to EBITDA: Acquisition and integration related expenses 446 334 1,852 2,143 Other significant non-recurring (income) expenses (4) (105) 364 (2,100) 6,527 Non-cash stock-based compensation expense 2,715 3,275 7,536 7,727 Adjusted EBITDA (non-GAAP) $ 16,732 $ 14,895 $ 16,582 $ 43,622