EX-99.1
Published on April 4, 2023
Safe Harbor Disclosure This presentation has been prepared by NeoGenomics, Inc. (“we,” ”us,” “our,” “NeoGenomics” or the “Company”) and is made for informational purposes only and does not constitute an offer to sell or a solicitation of an offer to buy securities, nor shall there be any sale of any securities in any state or jurisdiction in which such offer, solicitation or sale would be unlawful prior to registration or qualification under the securities laws of any such state or jurisdiction. The information set forth herein does not purport to be complete or to contain all of the information you may desire. Statements contained herein are made as of the date of this presentation unless stated otherwise, and neither this presentation, nor any sale of securities, shall under any circumstances create an implication that the information contained herein is correct as of any time after such date or that information will be updated or revised to reflect information that subsequently becomes available or changes occurring after the date hereof. This presentation contains “forward-looking statements” within the meaning of the Private Securities Litigation Reform Act of 1995 relating to business, operations, and financial conditions of the Company. Words such as, but not limited to, “look forward to,” “believe,” “expect,” “anticipate,” “suggest”, “project”, “forecast”, “estimate,” “intend,” “plan,” “would,” “should” and “could,” and similar expressions or words, identify forward-looking statements. Although the Company believes the expectations reflected in such forward-looking statements are based upon reasonable assumptions, there can be no assurance that its expectations will be realized. Actual results could differ materially from those projected in the Company’s forward-looking statements due to numerous known and unknown risks and uncertainties. All forward-looking statements speak only as of the date of this presentation and are qualified in their entirety by this cautionary statement. The Company undertakes no obligation to revise or update this presentation to reflect events or circumstances after the date hereof. Information contained in this presentation concerning our industry and the markets in which we operate, including our general expectations and market position, market opportunity and market size, is based on information from various sources, on assumptions that we have made that are based on such information and other similar sources and on our knowledge of, and expectations about, the markets for our service offerings. This information involves a number of assumptions and limitations, and you are cautioned not to give undue weight to such estimates. 2
Non-GAAP Financial Measures This presentation contains financial measures, such as adjusted EBITDA, adjusted gross margin and adjusted net income, which are considered non- GAAP financial measures under applicable U.S. Securities and Exchange Commission rules and regulations. These non-GAAP financial measures should be considered supplemental to, and not a substitute for, financial information prepared in accordance with U.S. generally accepted accounting principles (GAAP). Adjusted EBITDA, adjusted gross margin and adjusted net income, unusual or other items that we do not consider indicative of our ongoing operating performance. The Company’s definitions of these non-GAAP measures may differ from similarly titled measures used by others. The Company generally uses these non-GAAP financial measures to facilitate management’s financial and operational decision- making, including evaluation of the Company’s historical operating results, comparison to competitors’ operating results and determination of management incentive compensation. These non-GAAP financial measures reflect an additional way of viewing aspects of the Company’s operations that, when viewed with GAAP results and the reconciliations to corresponding GAAP financial measures, may provide a more complete understanding of factors and trends affecting the Company’s business. Because non-GAAP financial measures exclude the effect of items that will increase or decrease the Company’s reported results of operations, management strongly encourages investors to review the Company’s consolidated financial statements and publicly filed reports in their entirety. Reconciliations of the non-GAAP financial measures to the most directly comparable GAAP financial measures are included in the tables in this presentation. We cannot estimate or project these items and they may have a substantial and unpredictable impact on our results presented in accordance with GAAP. 3
Building a Foundation for Long-Term, Sustainable Growth Chris Smith Chief Executive Officer
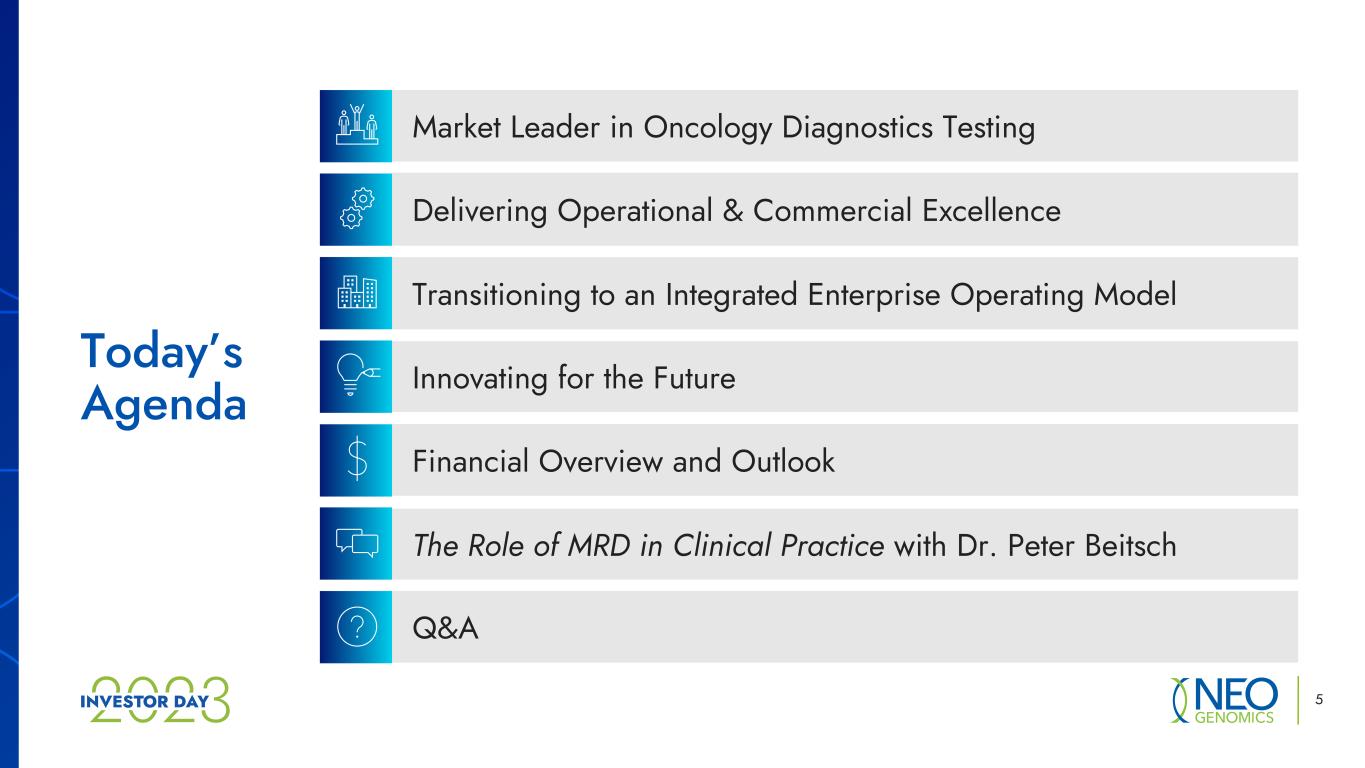
5 Today’s Agenda Q&A Financial Overview and Outlook The Role of MRD in Clinical Practice with Dr. Peter Beitsch Innovating for the Future Transitioning to an Integrated Enterprise Operating Model Delivering Operational & Commercial Excellence Market Leader in Oncology Diagnostics Testing

Mission We save lives by improving patient care. Vision We are becoming the world's leading cancer testing, information, and decision- support company by providing uncompromising quality, exceptional service, and innovative solutions. 6
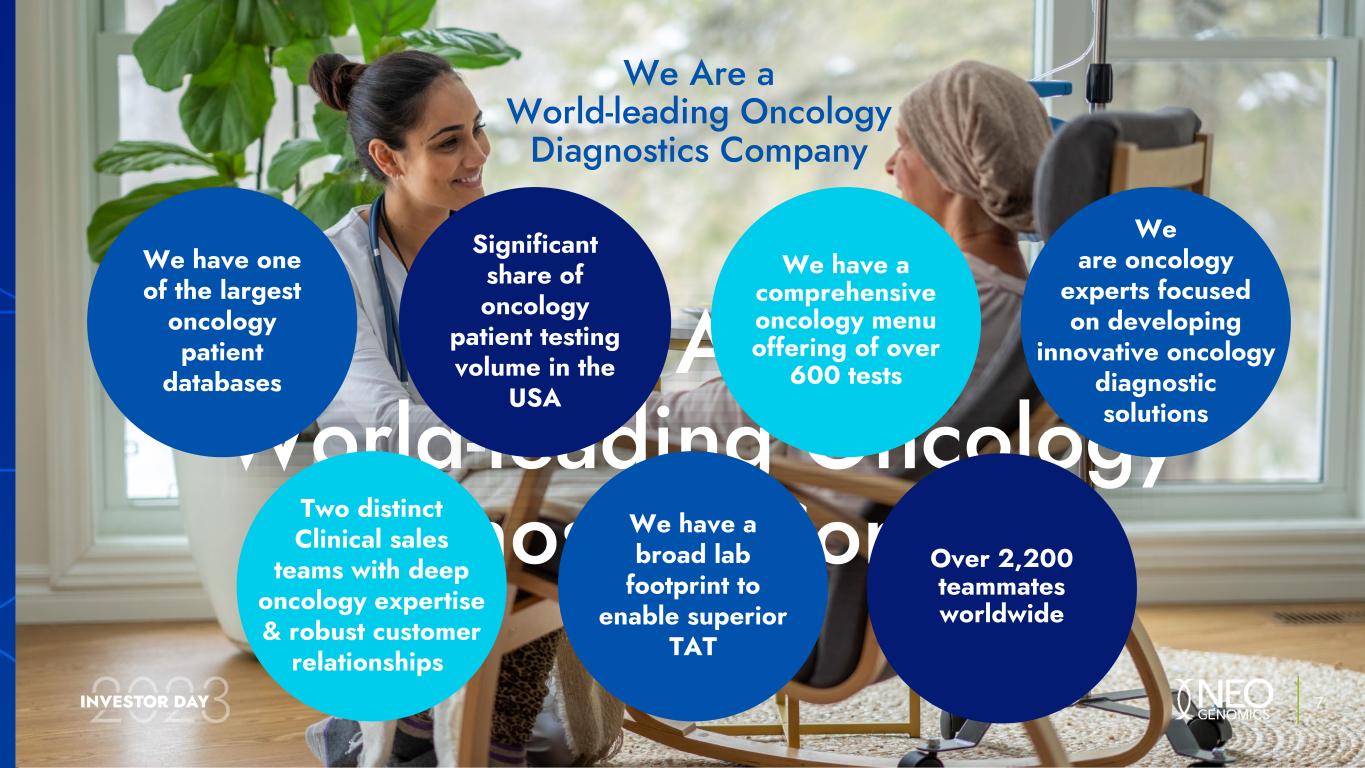
We Are a World-leading Oncology Diagnostics Company We Are a World-leading Oncology Diagnostics Company 7 We have a comprehensive oncology menu offering of over 600 tests We are oncology experts focused on developing innovative oncology diagnostic solutions We have one of the largest oncology patient databases Two distinct Clinical sales teams with deep oncology expertise & robust customer relationships Significant share of oncology patient testing volume in th USA We have a broad lab footprint to enable superior TAT Over 2,200 teammates worldwide
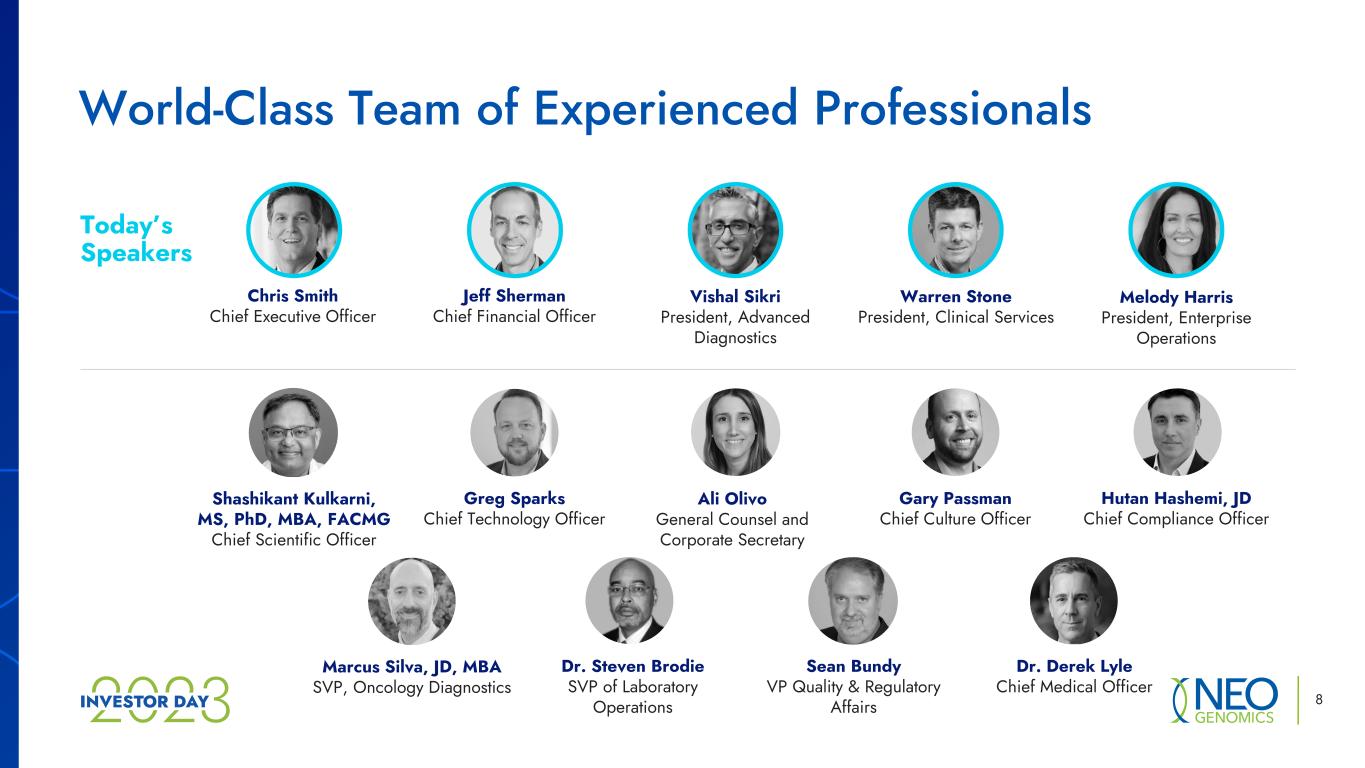
8 World-Class Team of Experienced Professionals Today’s Speakers Shashikant Kulkarni, MS, PhD, MBA, FACMG Chief Scientific Officer Marcus Silva, JD, MBA SVP, Oncology Diagnostics Greg Sparks Chief Technology Officer Ali Olivo General Counsel and Corporate Secretary Gary Passman Chief Culture Officer Hutan Hashemi, JD Chief Compliance Officer Jeff Sherman Chief Financial Officer Vishal Sikri President, Advanced Diagnostics Warren Stone President, Clinical Services Melody Harris President, Enterprise Operations Chris Smith Chief Executive Officer Dr. Derek Lyle Chief Medical Officer Sean Bundy VP Quality & Regulatory Affairs Dr. Steven Brodie SVP of Laboratory Operations
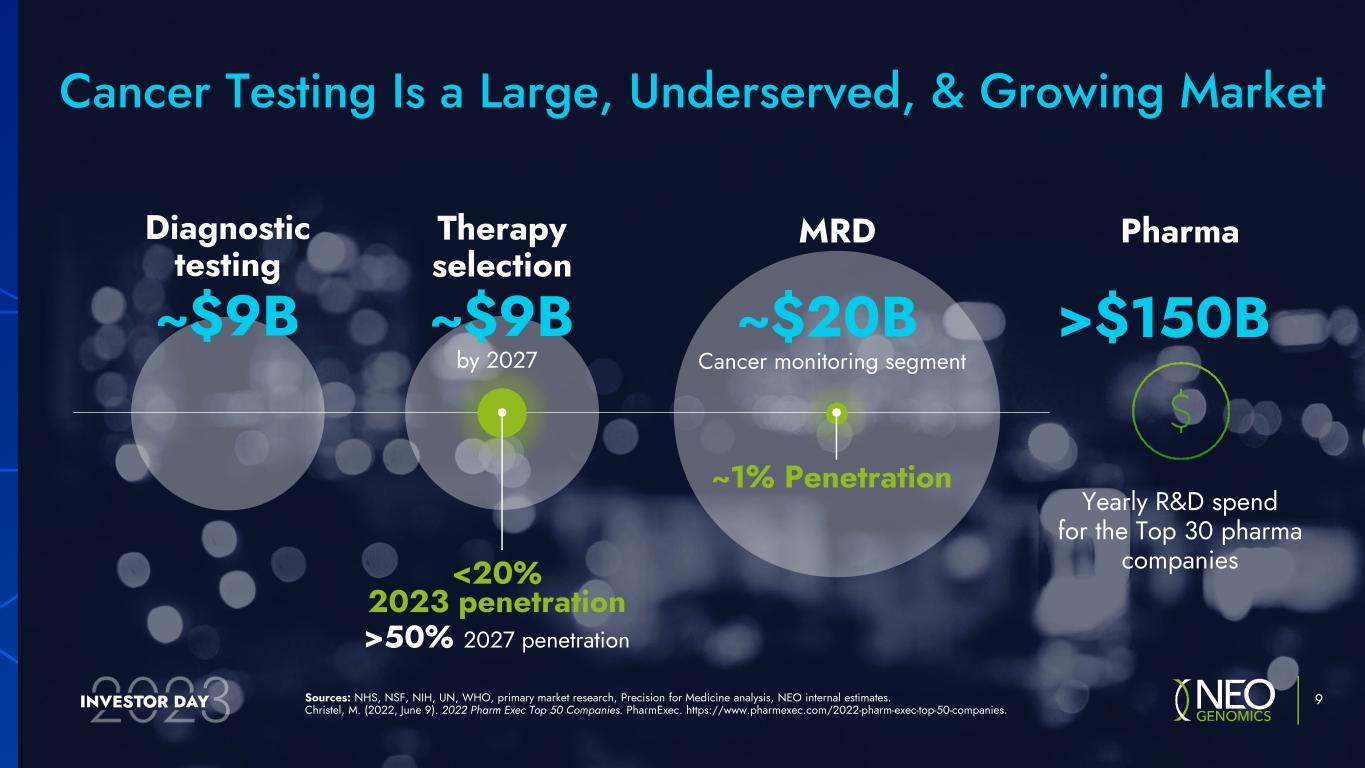
Sources: NHS, NSF, NIH, UN, WHO, primary market research, Precision for Medicine analysis, NEO internal estimates. Christel, M. (2022, June 9). 2022 Pharm Exec Top 50 Companies. PharmExec. https://www.pharmexec.com/2022-pharm-exec-top-50-companies. 9 Cancer Testing Is a Large, Underserved, & Growing Market Therapy selection Pharma ~$9B by 2027 Yearly R&D spend for the Top 30 pharma companies >50% 2027 penetration <20% 2023 penetration MRD ~$20B ~1% Penetration Cancer monitoring segment Diagnostic testing ~$9B >$150B
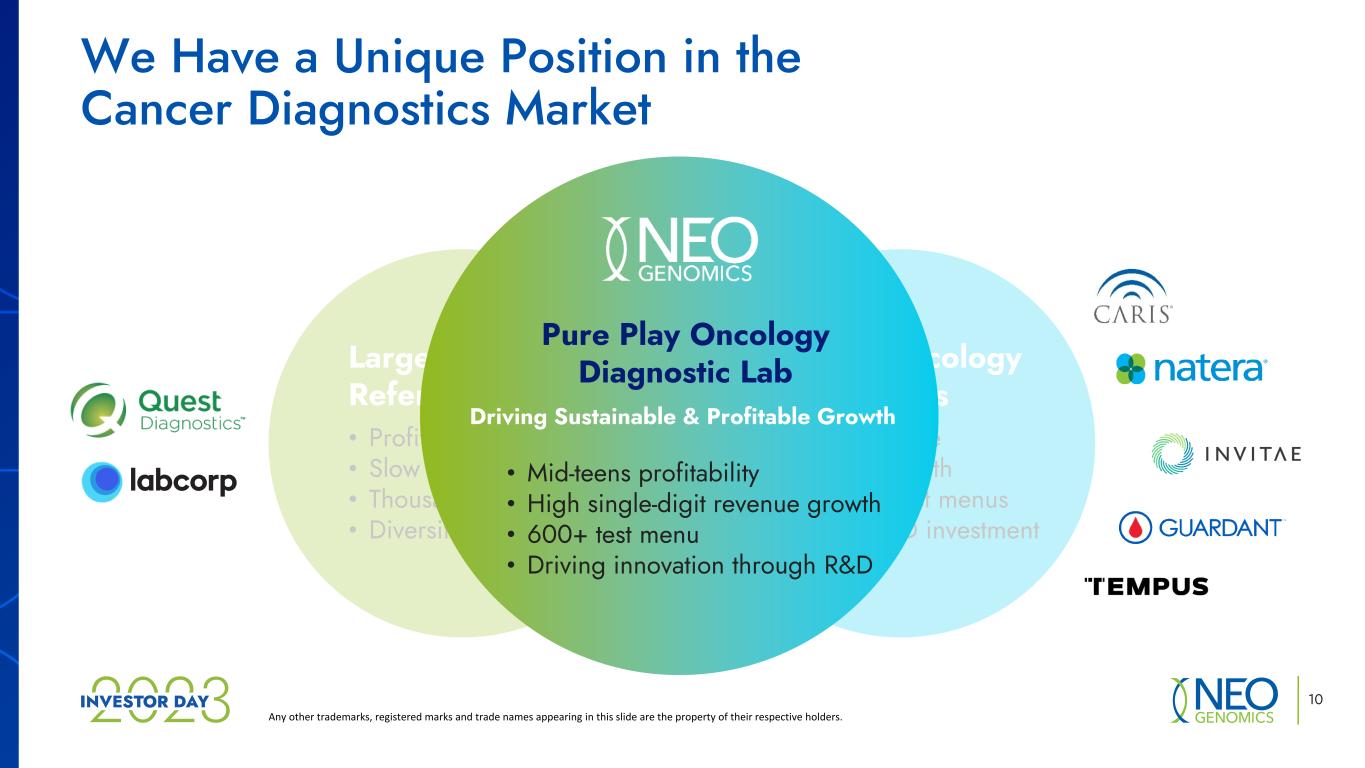
We Have a Unique Position in the Cancer Diagnostics Market Any other trademarks, registered marks and trade names appearing in this slide are the property of their respective holders. Large Clinical Reference Labs • Profitable • Slow growth • Thousands of tests • Diversified focus Niche Oncology Companies • Unprofitable • Rapid growth • Limited test menus • High R&D investment We enjoy a unique position in the clinical market 10 • Mid-teens profitability • High single-digit revenue growth • 600+ test menu • Driving innovation through R&D Pure Play Oncology Diagnostic Lab Driving Sustainabl & Profitable Growth

11 Moving into 2023
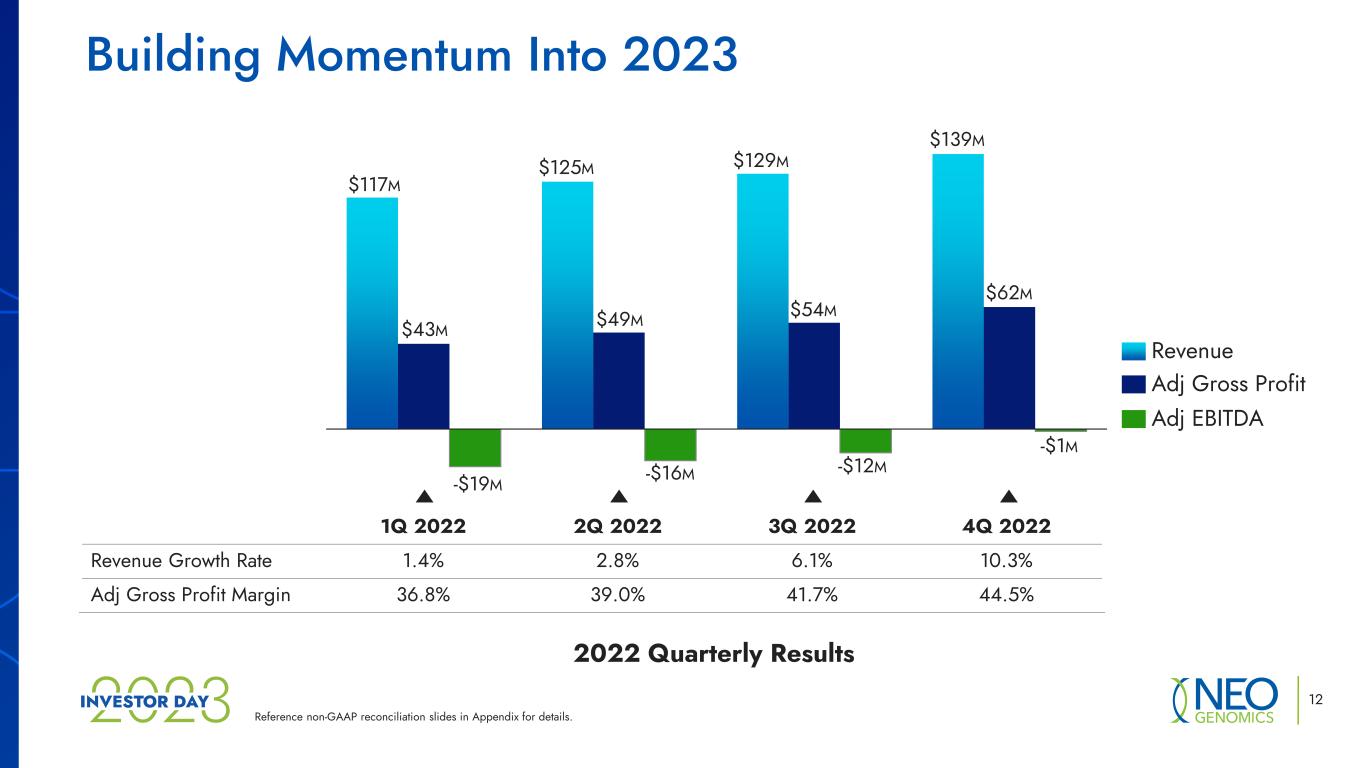
Reference non-GAAP reconciliation slides in Appendix for details. Building Momentum Into 2023 1Q 2022 2Q 2022 3Q 2022 4Q 2022 Revenue Growth Rate 1.4% 2.8% 6.1% 10.3% Adj Gross Profit Margin 36.8% 39.0% 41.7% 44.5% $54M $129M $43M $117M -$19M $125M -$1M -$16M $49M -$12M $139M $62M Adj EBITDA Revenue Adj Gross Profit 12 2022 Quarterly Results
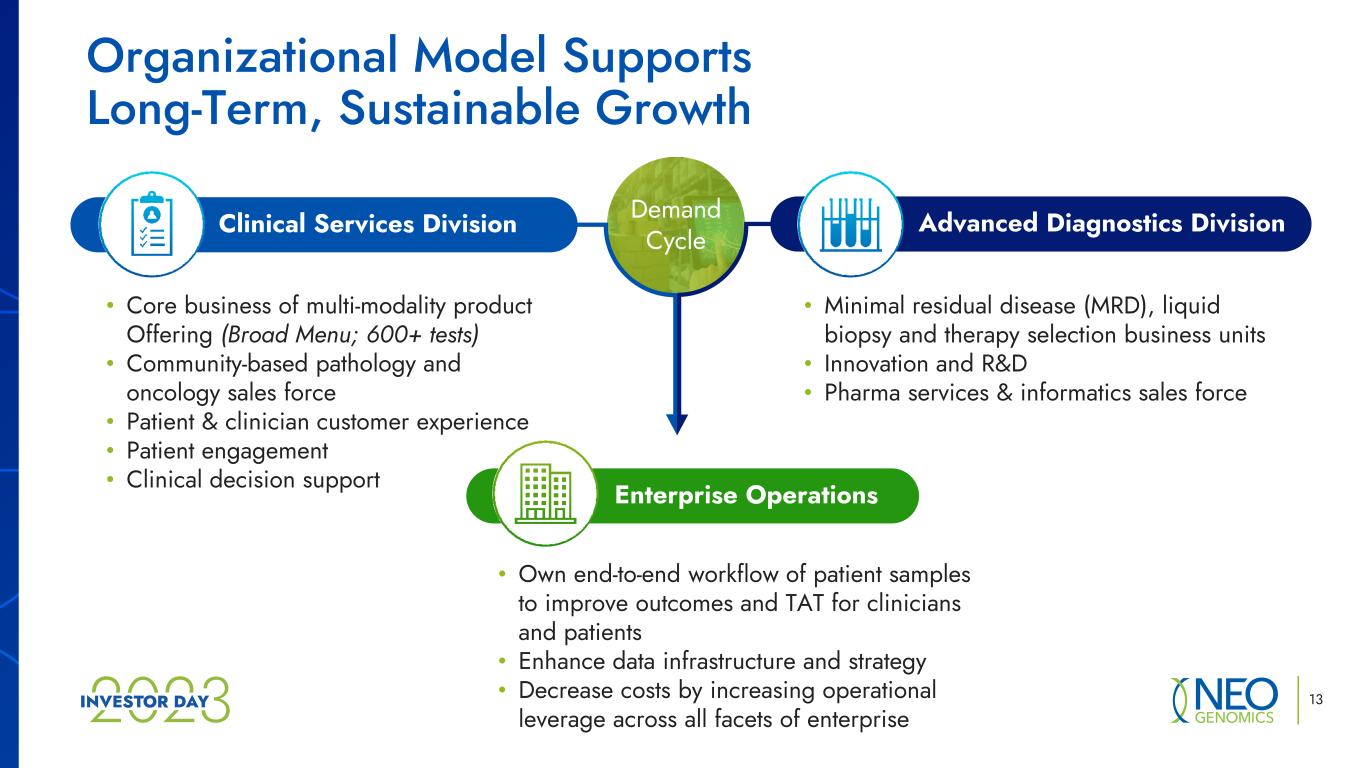
Demand Cycle • Own end-to-end workflow of patient samples to improve outcomes and TAT for clinicians and patients • Enhance data infrastructure and strategy • Decrease costs by increasing operational leverage across all facets of enterprise • Minimal residual disease (MRD), liquid biopsy and therapy selection business units • Innovation and R&D • Pharma services & informatics sales force • Core business of multi-modality product Offering (Broad Menu; 600+ tests) • Community-based pathology and oncology sales force • Patient & clinician customer experience • Patient engagement • Clinical decision support Organizational Model Supports Long-Term, Sustainable Growth Clinical Services Division Advanced Diagnostics Division Enterprise Operations 13
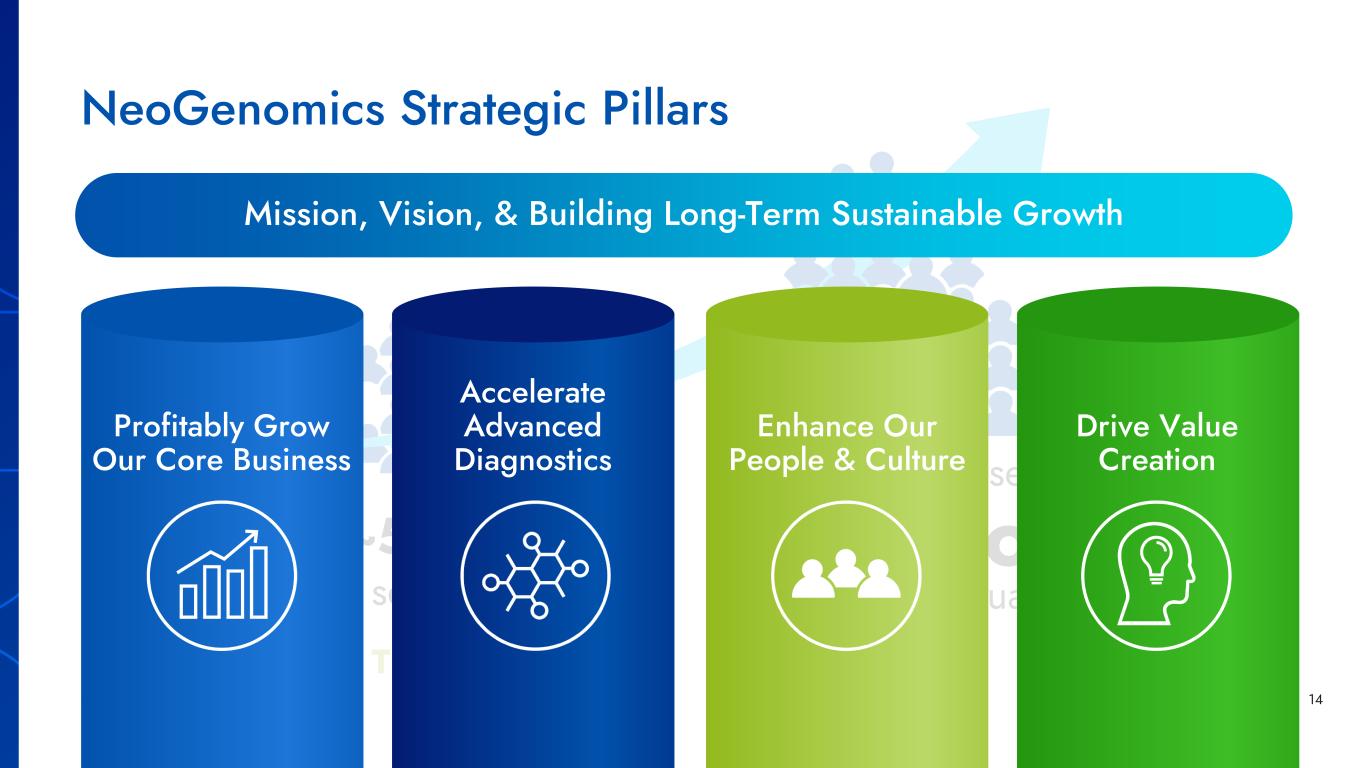
TODAY ~540K Patients served annually On our way to serving patients annually 1 million 2028 NeoGenomics Strategic Pillars Mission, Vision, & Building Long-Term Sustainable Growth Profitably Grow Our Core Business Enhance Our People & Culture Drive Value Creation Accelerate Advanced Diagnostics 14
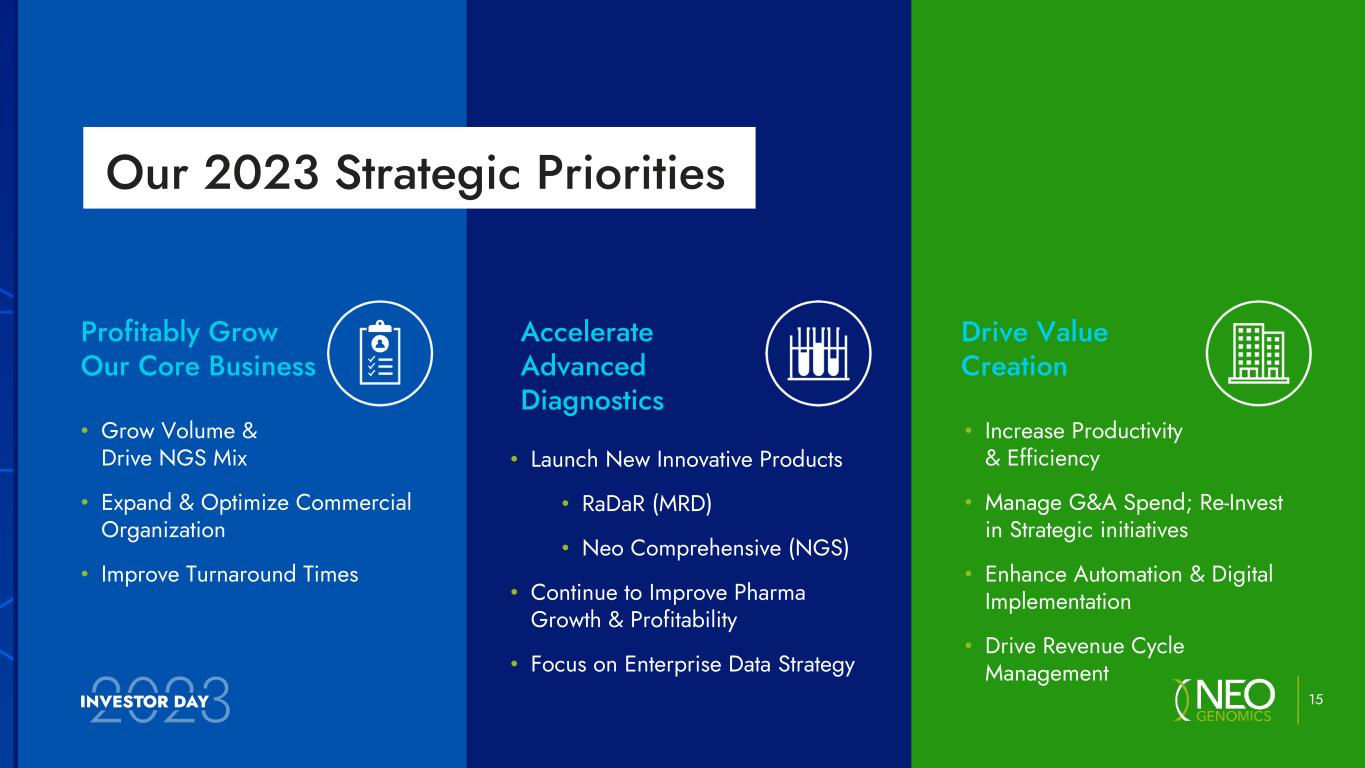
Drive Value Creation • Increase Productivity & Efficiency • Manage G&A Spend; Re-Invest in Strategic initiatives • Enhance Automation & Digital Implementation • Drive Revenue Cycle Management Accelerate Advanced Diagnostics • Launch New Innovative Products • RaDaR (MRD) • Neo Comprehensive (NGS) • Continue to Improve Pharma Growth & Profitability • Focus on Enterprise Data Strategy Profitably Grow Our Core Business • Grow Volume & Drive NGS Mix • Expand & Optimize Commercial Organization • Improve Turnaround Times 15 Our 2023 Strategic Priorities
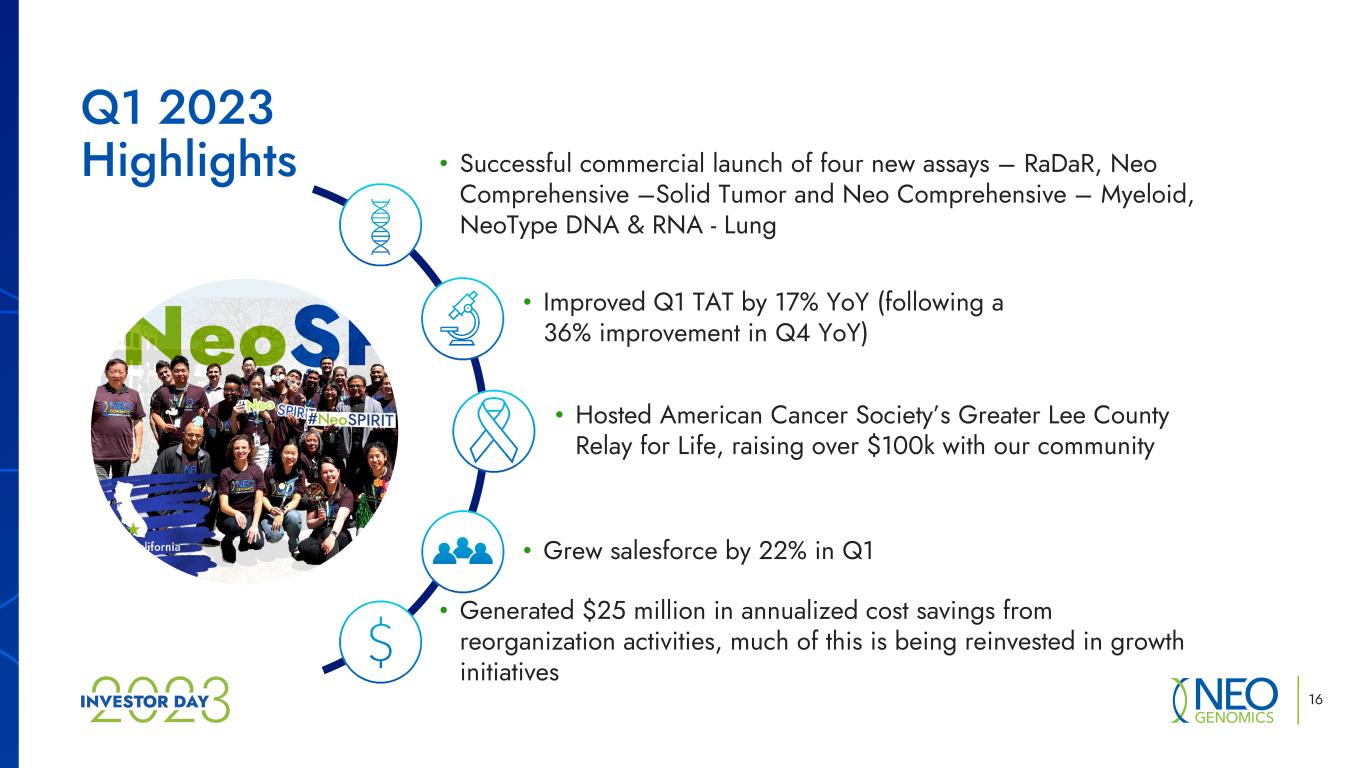
16 Q1 2023 Highlights • Improved Q1 TAT by 17% YoY (following a 36% improvement in Q4 YoY) • Generated $25 million in annualized cost savings from reorganization activities, much of this is being reinvested in growth initiatives • Successful commercial launch of four new assays – RaDaR, Neo Comprehensive –Solid Tumor and Neo Comprehensive – Myeloid, NeoType DNA & RNA - Lung • Hosted American Cancer Society’s Greater Lee County Relay for Life, raising over $100k with our community • Grew salesforce by 22% in Q1
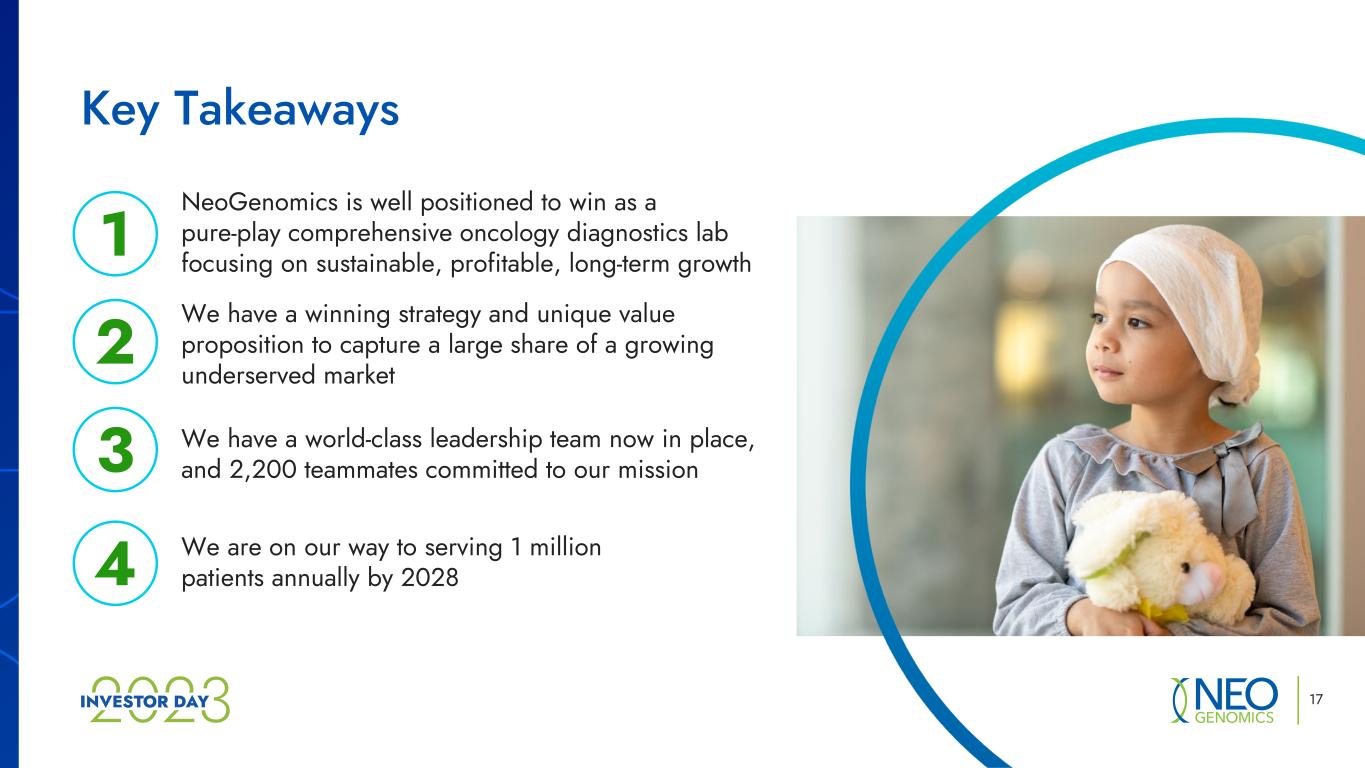
Key Takeaways We have a world-class leadership team now in place, and 2,200 teammates committed to our mission We have a winning strategy and unique value proposition to capture a large share of a growing underserved market NeoGenomics is well positioned to win as a pure-play comprehensive oncology diagnostics lab focusing on sustainable, profitable, long-term growth1 2 3 We are on our way to serving 1 million patients annually by 20284 17

Delivering Operational & Commercial Excellence Warren Stone President, Clinical Services Division
Revenue Cycle Management 19 Customer Experience Portfolio Optimization Commercial Execution 2023 Key Priorities
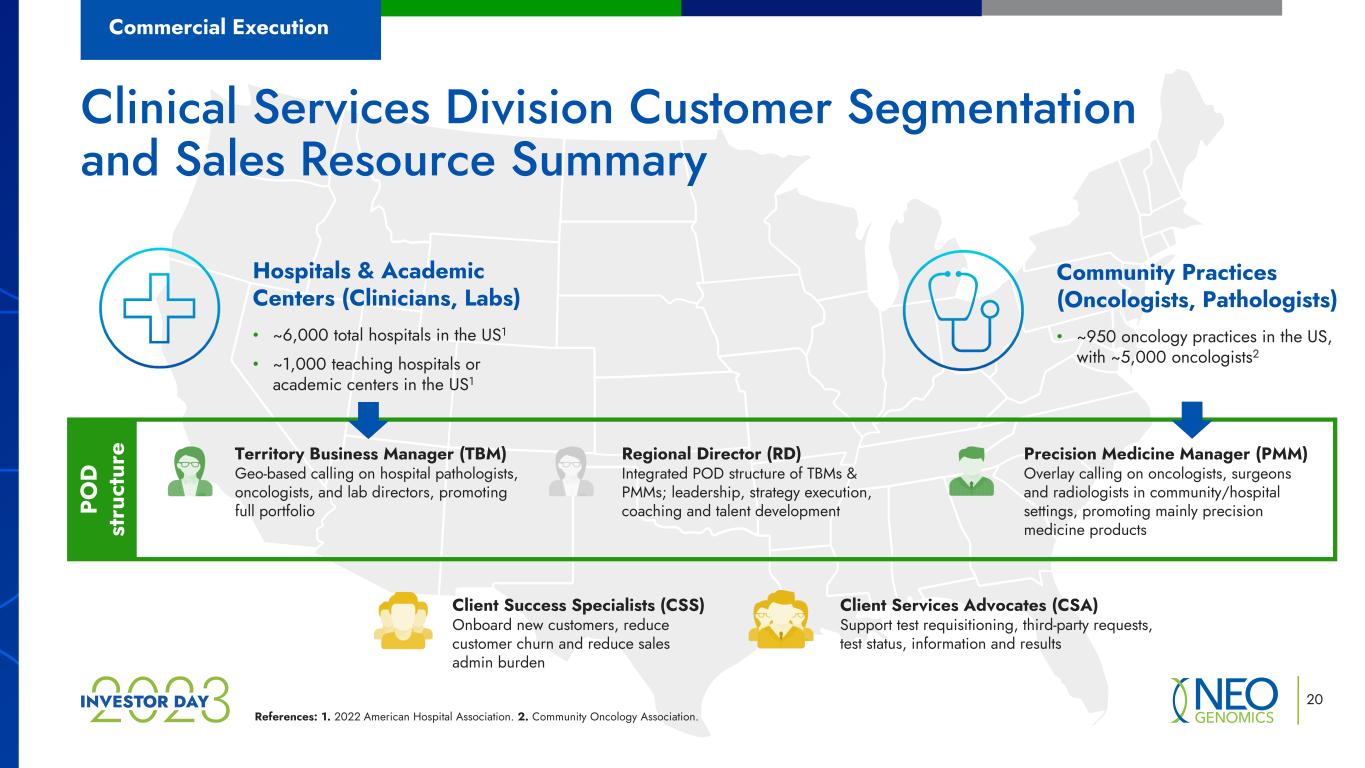
20 Clinical Services Division Customer Segmentation and Sales Resource Summary Commercial Execution Hospitals & Academic Centers (Clinicians, Labs) • ~6,000 total hospitals in the US1 • ~1,000 teaching hospitals or academic centers in the US1 Community Practices (Oncologists, Pathologists) • ~950 oncology practices in the US, with ~5,000 oncologists2 Territory Business Manager (TBM) Geo-based calling on hospital pathologists, oncologists, and lab directors, promoting full portfolio Precision Medicine Manager (PMM) Overlay calling on oncologists, surgeons and radiologists in community/hospital settings, promoting mainly precision medicine products Regional Director (RD) Integrated POD structure of TBMs & PMMs; leadership, strategy execution, coaching and talent development References: 1. 2022 American Hospital Association. 2. Community Oncology Association. Client Success Specialists (CSS) Onboard new customers, reduce customer churn and reduce sales admin burden Client Services Advocates (CSA) Support test requisitioning, third-party requests, test status, information and results PO D st ru ct ur e
21 Commercial Execution Protect Expand Win Commercial Growth Strategy
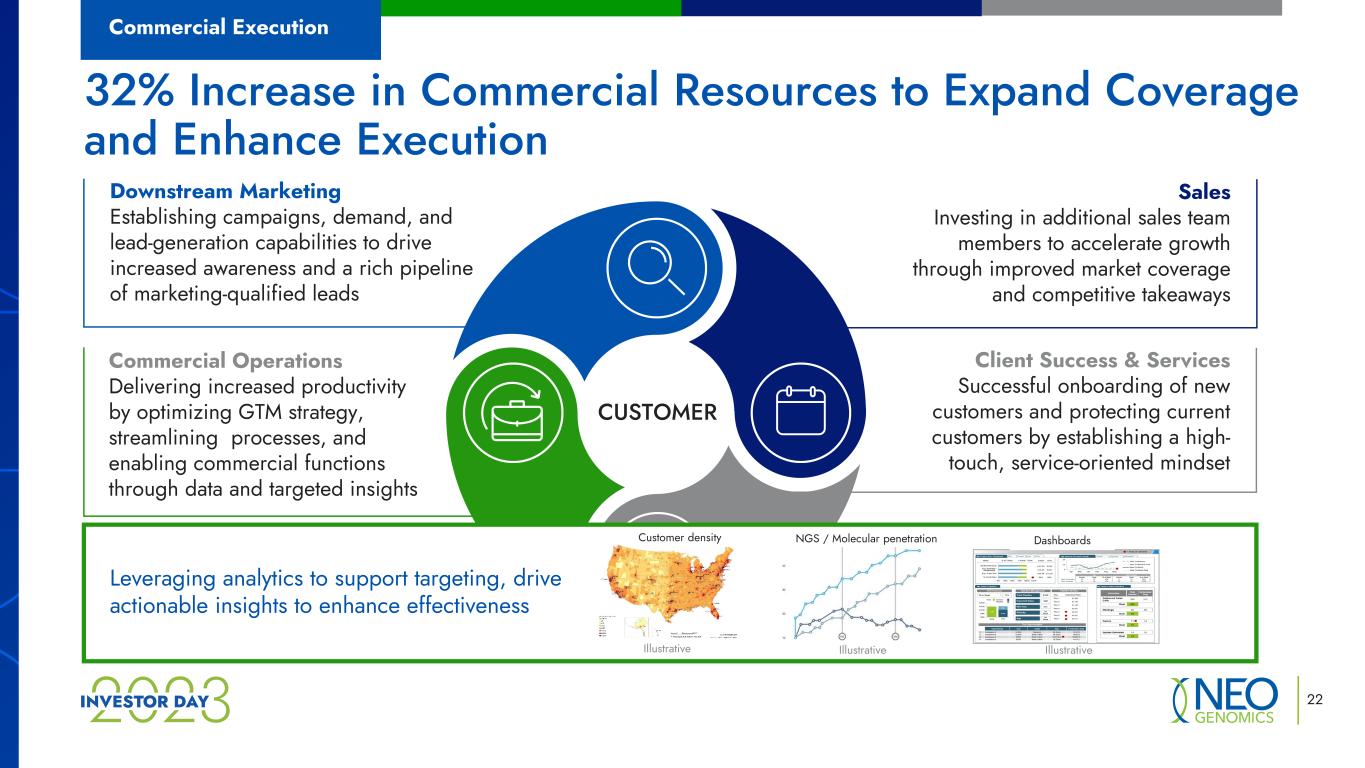
Downstream Marketing Establishing campaigns, demand, and lead-generation capabilities to drive increased awareness and a rich pipeline of marketing-qualified leads 22 32% Increase in Commercial Resources to Expand Coverage and Enhance Execution Commercial Execution CUSTOMER Sales Investing in additional sales team members to accelerate growth through improved market coverage and competitive takeaways Commercial Operations Delivering increased productivity by optimizing GTM strategy, streamlining processes, and enabling commercial functions through data and targeted insights Client Success & Services Successful onboarding of new customers and protecting current customers by establishing a high- touch, service-oriented mindset Leveraging analytics to support targeting, drive actionable insights to enhance effectiveness Customer density NGS / Molecular penetration Illustrative IllustrativeIllustrative Dashboards
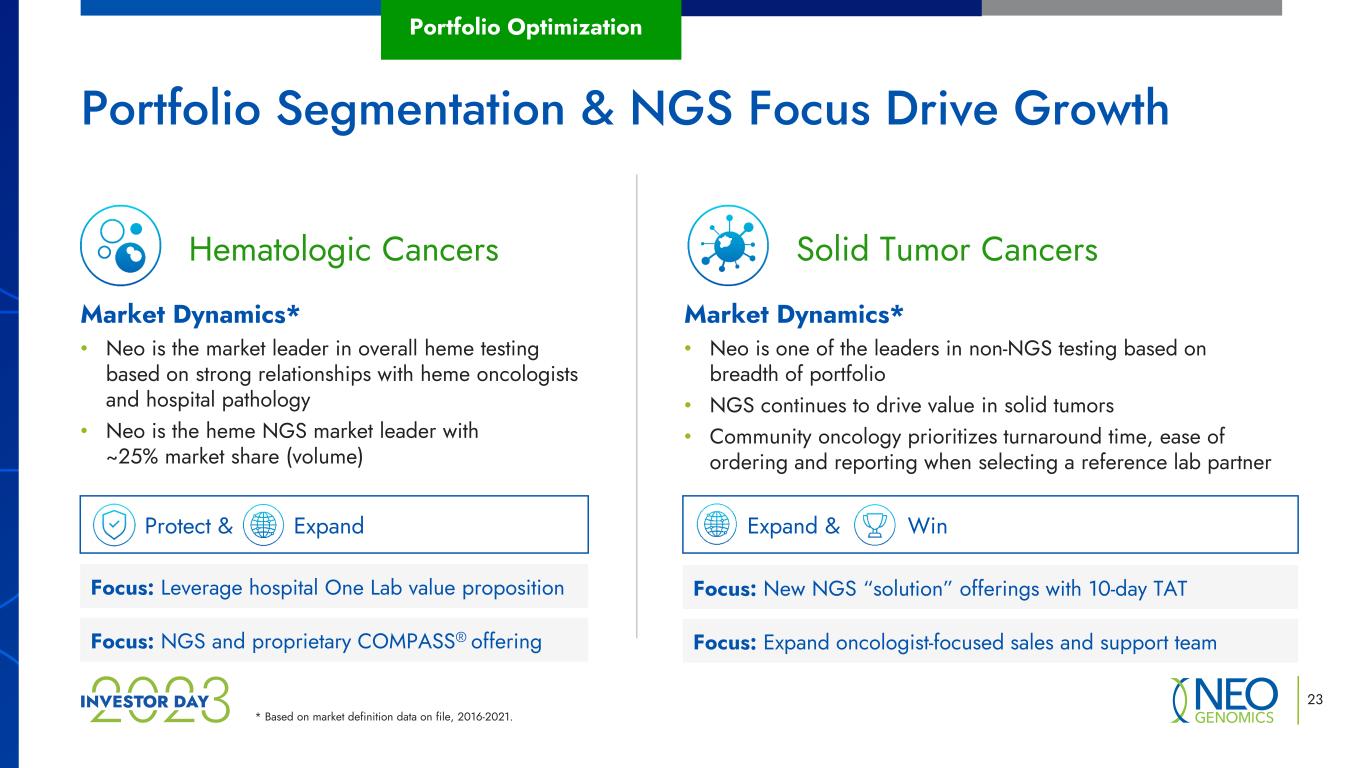
* Based on market definition data on file, 2016-2021. 23 Portfolio Segmentation & NGS Focus Drive Growth Portfolio Optimization Market Dynamics* • Neo is the market leader in overall heme testing based on strong relationships with heme oncologists and hospital pathology • Neo is the heme NGS market leader with ~25% market share (volume) Protect & Expand Solid Tumor CancersHematologic Cancers Market Dynamics* • Neo is one of the leaders in non-NGS testing based on breadth of portfolio • NGS continues to drive value in solid tumors • Community oncology prioritizes turnaround time, ease of ordering and reporting when selecting a reference lab partner Focus: Leverage hospital One Lab value proposition Focus: NGS and proprietary COMPASS® offering Expand & Win Focus: New NGS “solution” offerings with 10-day TAT Focus: Expand oncologist-focused sales and support team
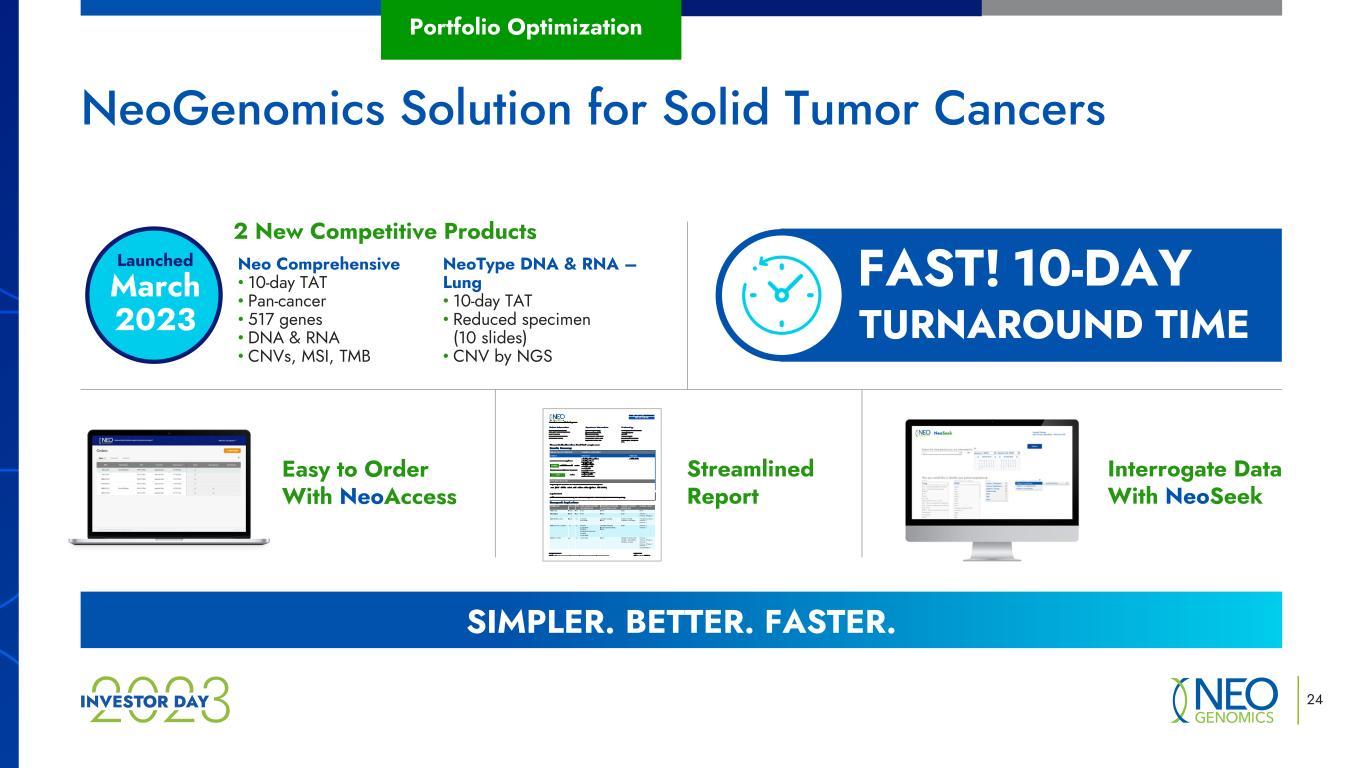
24 Portfolio Optimization Easy to Order With NeoAccess Streamlined Report Interrogate Data With NeoSeek NeoType DNA & RNA – Lung • 10-day TAT • Reduced specimen (10 slides) • CNV by NGS 2 New Competitive Products Neo Comprehensive • 10-day TAT • Pan-cancer • 517 genes • DNA & RNA • CNVs, MSI, TMB FAST! 10-DAY TURNAROUND TIME SIMPLER. BETTER. FASTER. NeoGenomics Solution for Solid Tumor Cancers Launched March 2023
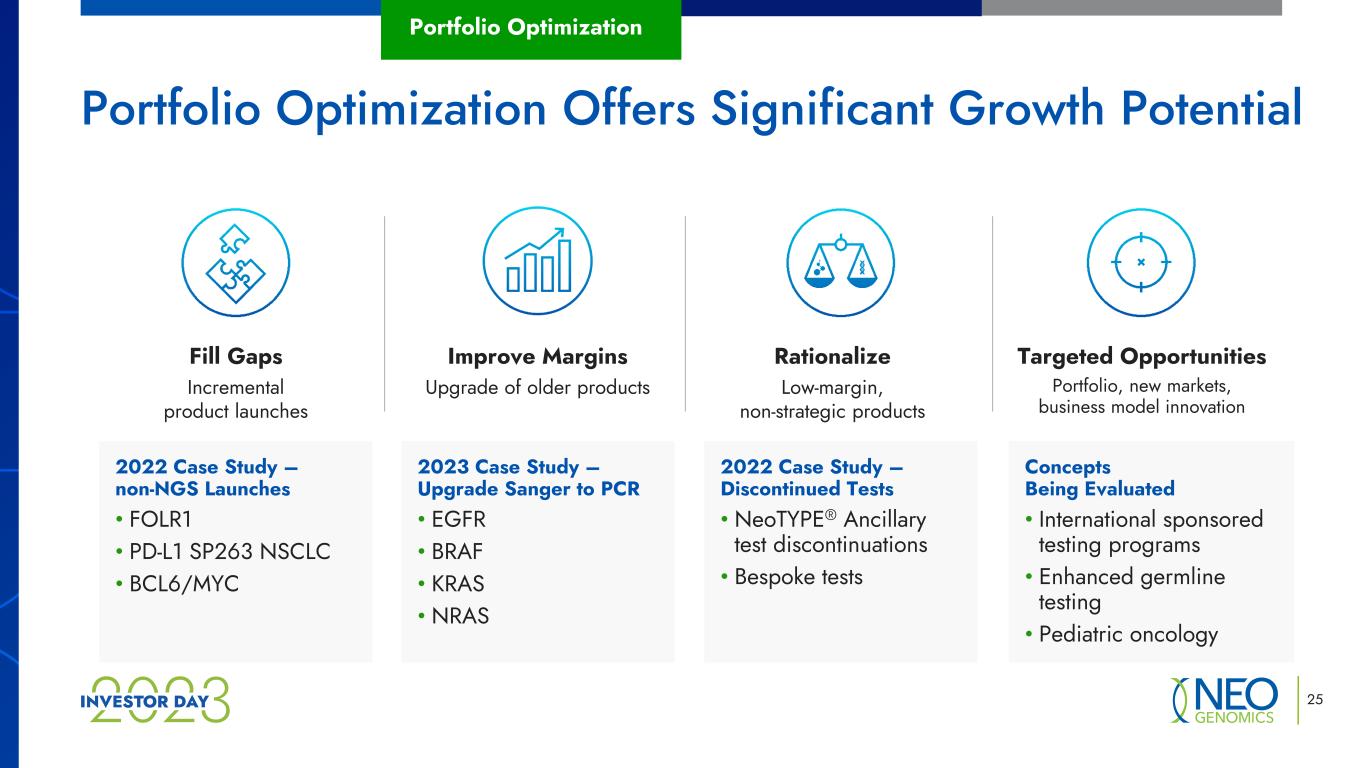
25 Portfolio Optimization Portfolio Optimization Offers Significant Growth Potential Targeted Opportunities Portfolio, new markets, business model innovation Concepts Being Evaluated • International sponsored testing programs • Enhanced germline testing • Pediatric oncology Rationalize Low-margin, non-strategic products Improve Margins Upgrade of older products 2023 Case Study – Upgrade Sanger to PCR • EGFR • BRAF • KRAS • NRAS 2022 Case Study – Discontinued Tests • NeoTYPE® Ancillary test discontinuations • Bespoke tests Fill Gaps Incremental product launches 2022 Case Study – non-NGS Launches • FOLR1 • PD-L1 SP263 NSCLC • BCL6/MYC
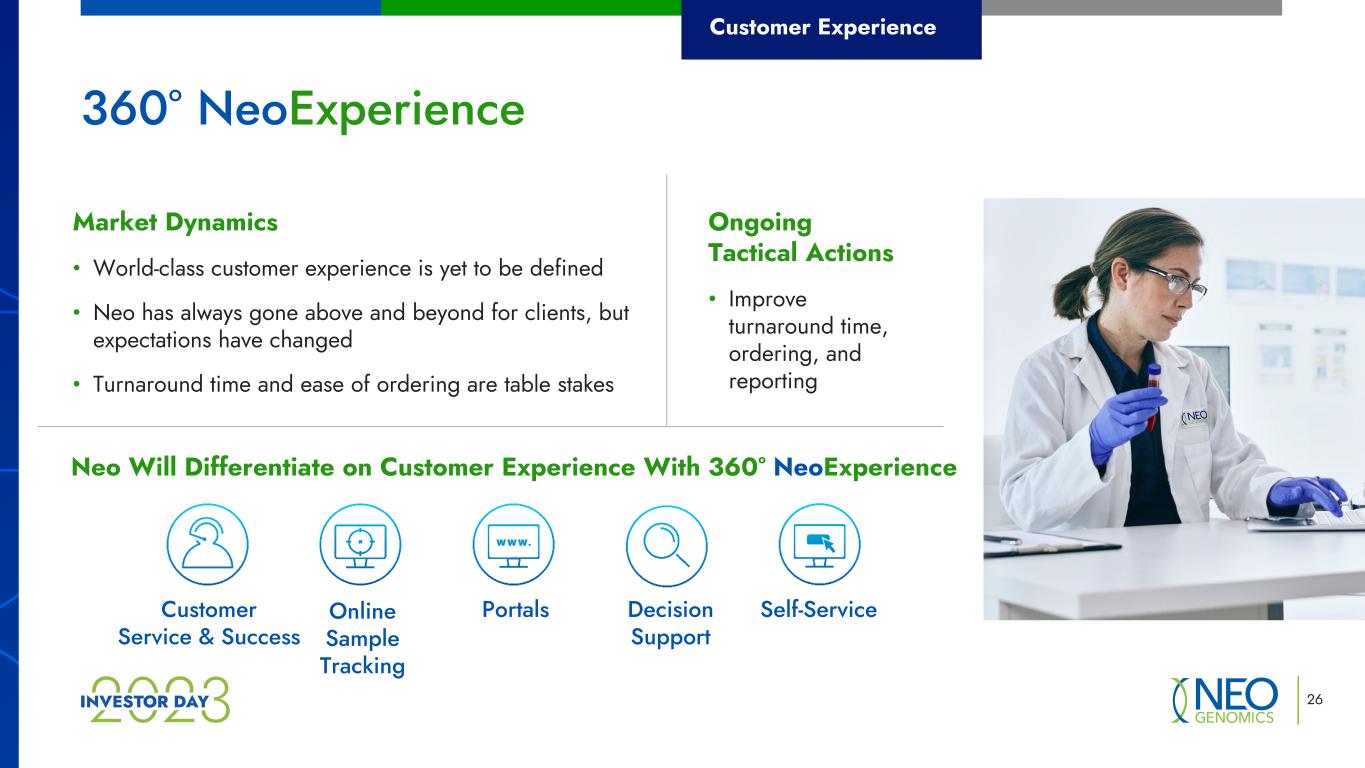
360° NeoExperience 26 Customer Experience Market Dynamics • World-class customer experience is yet to be defined • Neo has always gone above and beyond for clients, but expectations have changed • Turnaround time and ease of ordering are table stakes Ongoing Tactical Actions • Improve turnaround time, ordering, and reporting Neo Will Differentiate on Customer Experience With 360° NeoExperience Customer Service & Success Portals Decision Support Self-ServiceOnline Sample Tracking
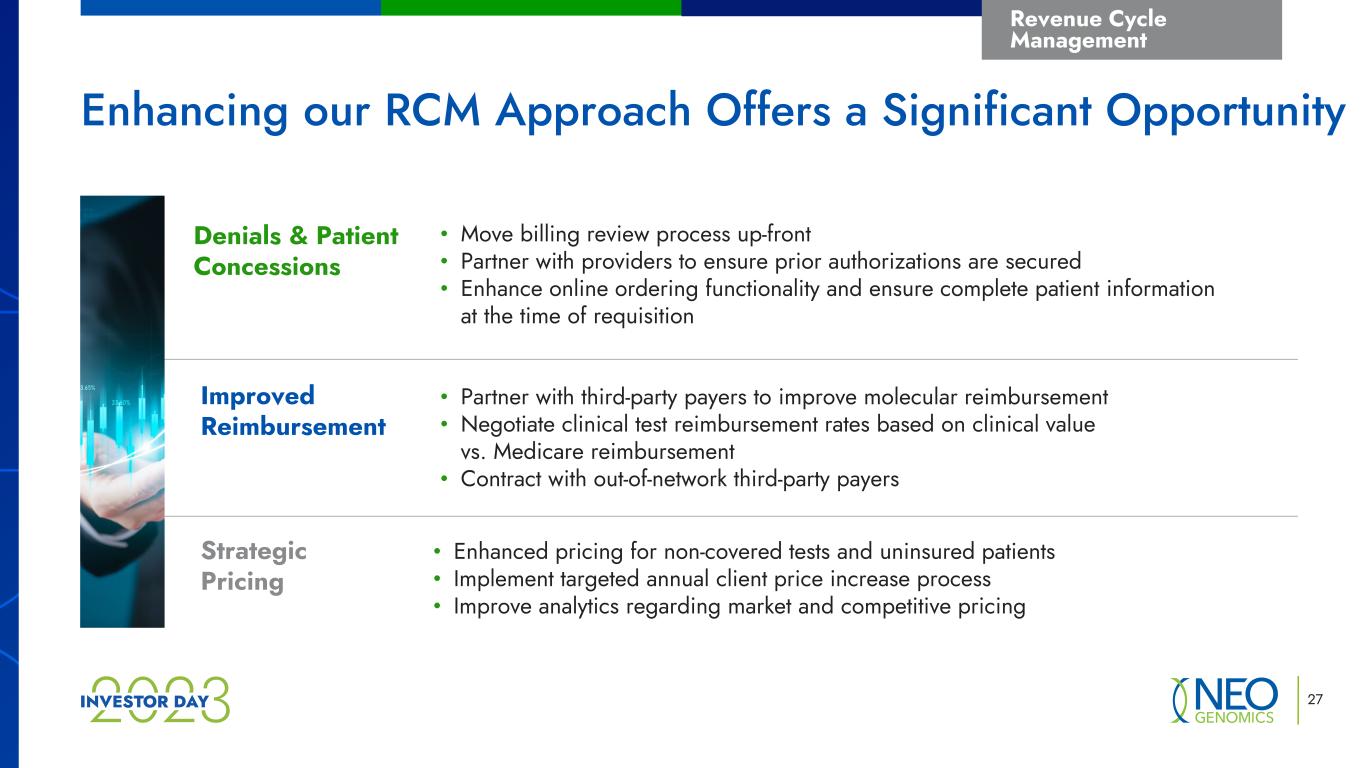
27 Revenue Cycle Management • Move billing review process up-front • Partner with providers to ensure prior authorizations are secured • Enhance online ordering functionality and ensure complete patient information at the time of requisition • Partner with third-party payers to improve molecular reimbursement • Negotiate clinical test reimbursement rates based on clinical value vs. Medicare reimbursement • Contract with out-of-network third-party payers • Enhanced pricing for non-covered tests and uninsured patients • Implement targeted annual client price increase process • Improve analytics regarding market and competitive pricing Denials & Patient Concessions Improved Reimbursement Strategic Pricing Enhancing our RCM Approach Offers a Significant Opportunity
28 Key Takeaways Revenue Cycle Management will enable significant bottom-line leverage New products and portfolio optimization offers meaningful upside potential Sales and commercial investment, analytics and execution will drive continuous and sustainable growth 1 2 3 We will differentiate through Customer Experience with NeoExperience 4

Transitioning to an Integrated Operating Model Melody Harris President, Enterprise Operations
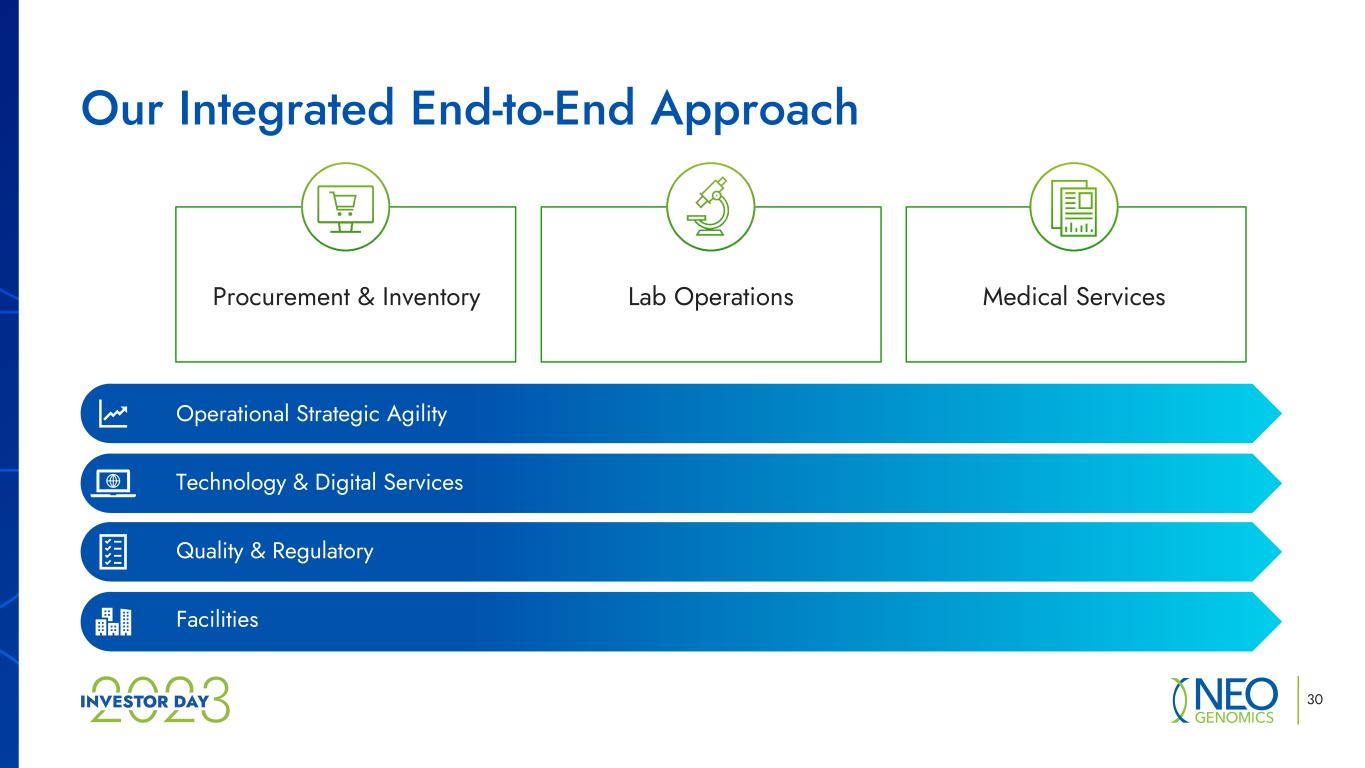
30 Our Integrated End-to-End Approach Procurement & Inventory Lab Operations Medical Services Operational Strategic Agility Technology & Digital Services Quality & Regulatory Facilities
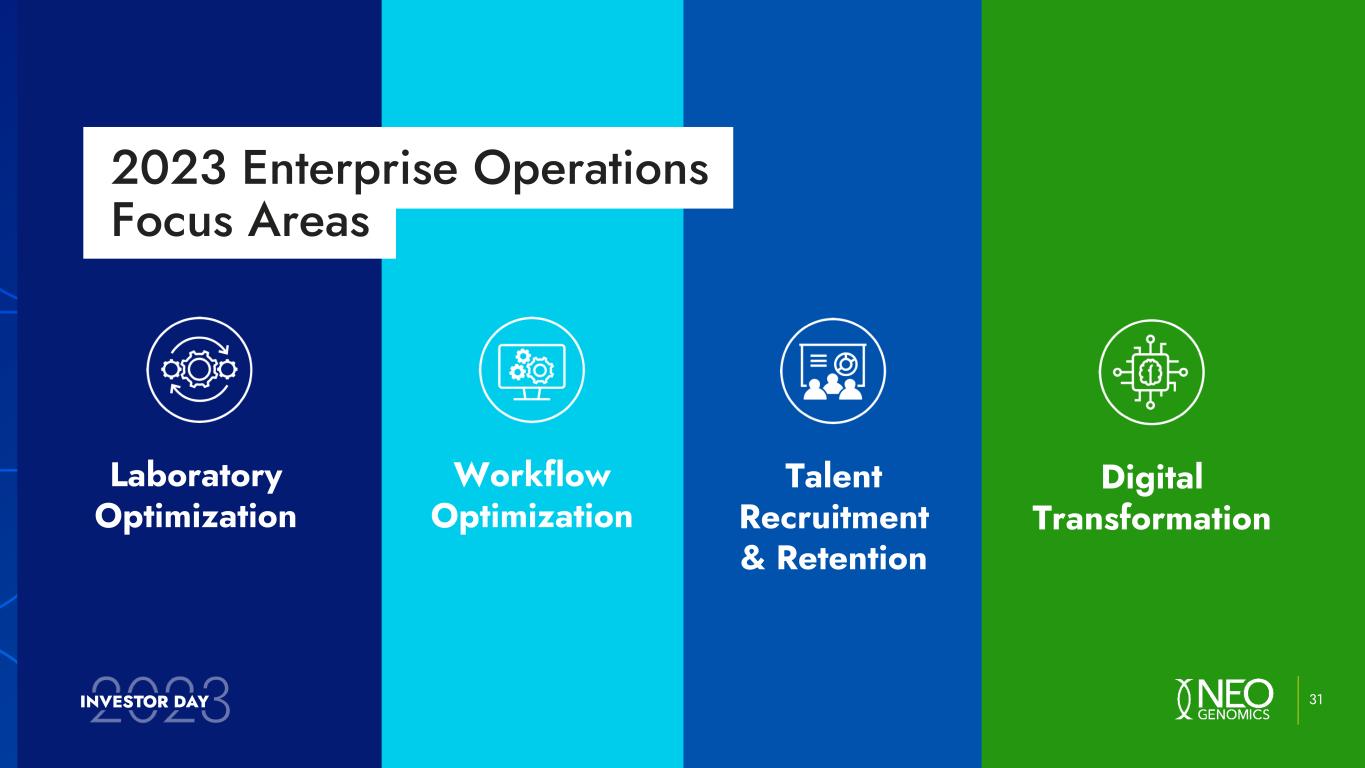
Digital Transformation 31 Talent Recruitment & Retention Workflow Optimization Laboratory Optimization 2023 Enterprise Operations Focus Areas
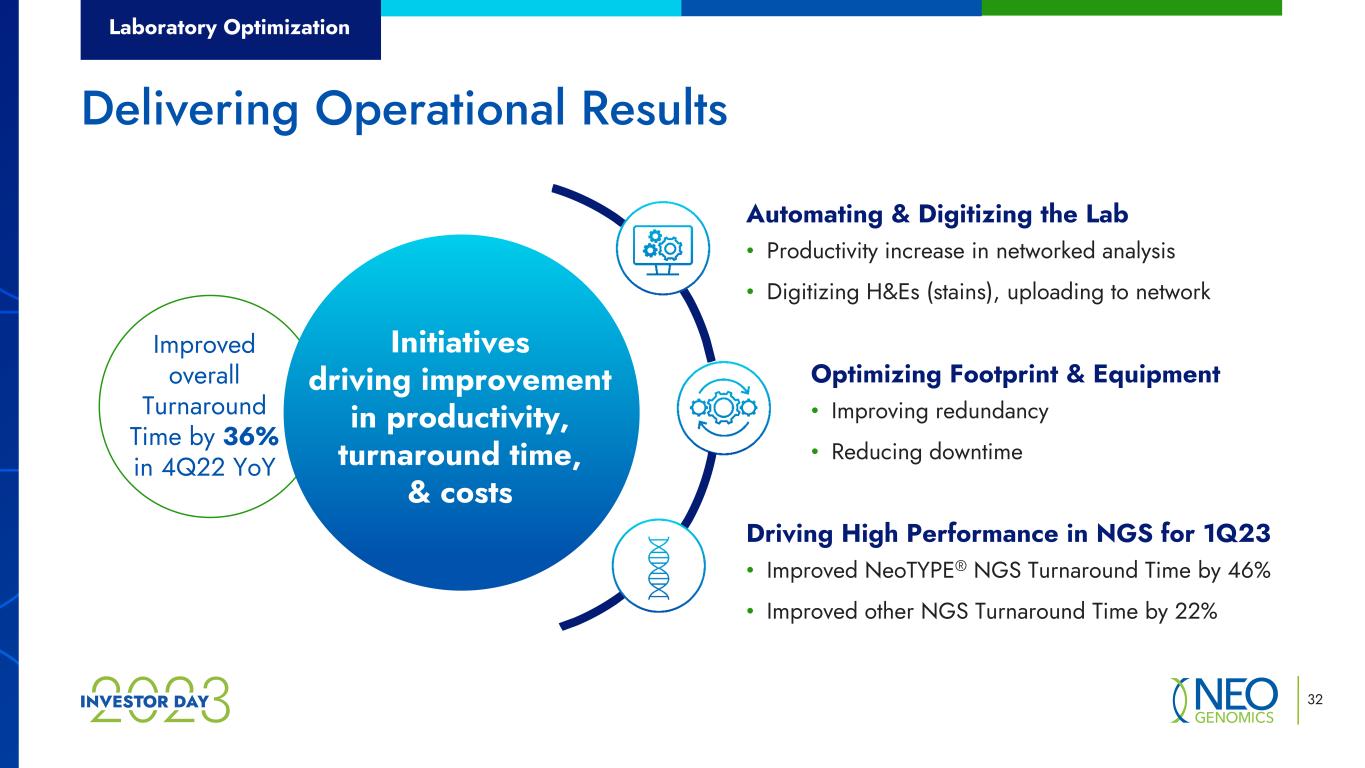
Laboratory Optimization 32 Delivering Operational Results • Improving redundancy • Reducing downtime Optimizing Footprint & Equipment • Improved NeoTYPE® NGS Turnaround Time by 46% • Improved other NGS Turnaround Time by 22% Driving High Performance in NGS for 1Q23 • Productivity increase in networked analysis • Digitizing H&Es (stains), uploading to network Automating & Digitizing the Lab Improved overall Turnaround Time by 36% in 4Q22 YoY Initiatives driving improvement in productivity, turnaround time, & costs
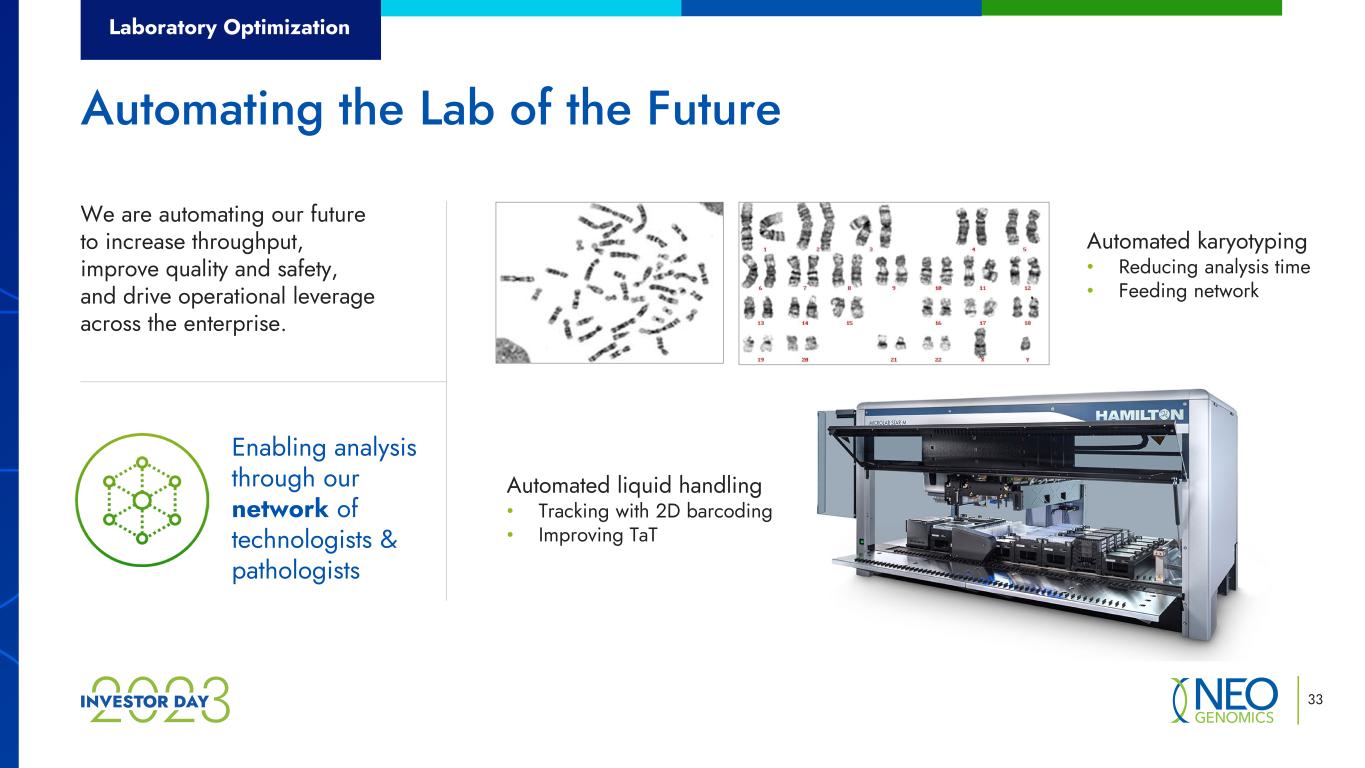
Laboratory Optimization 33 Automating the Lab of the Future We are automating our future to increase throughput, improve quality and safety, and drive operational leverage across the enterprise. Automated karyotyping • Reducing analysis time • Feeding network Automated liquid handling • Tracking with 2D barcoding • Improving TaT Enabling analysis through our network of technologists & pathologists
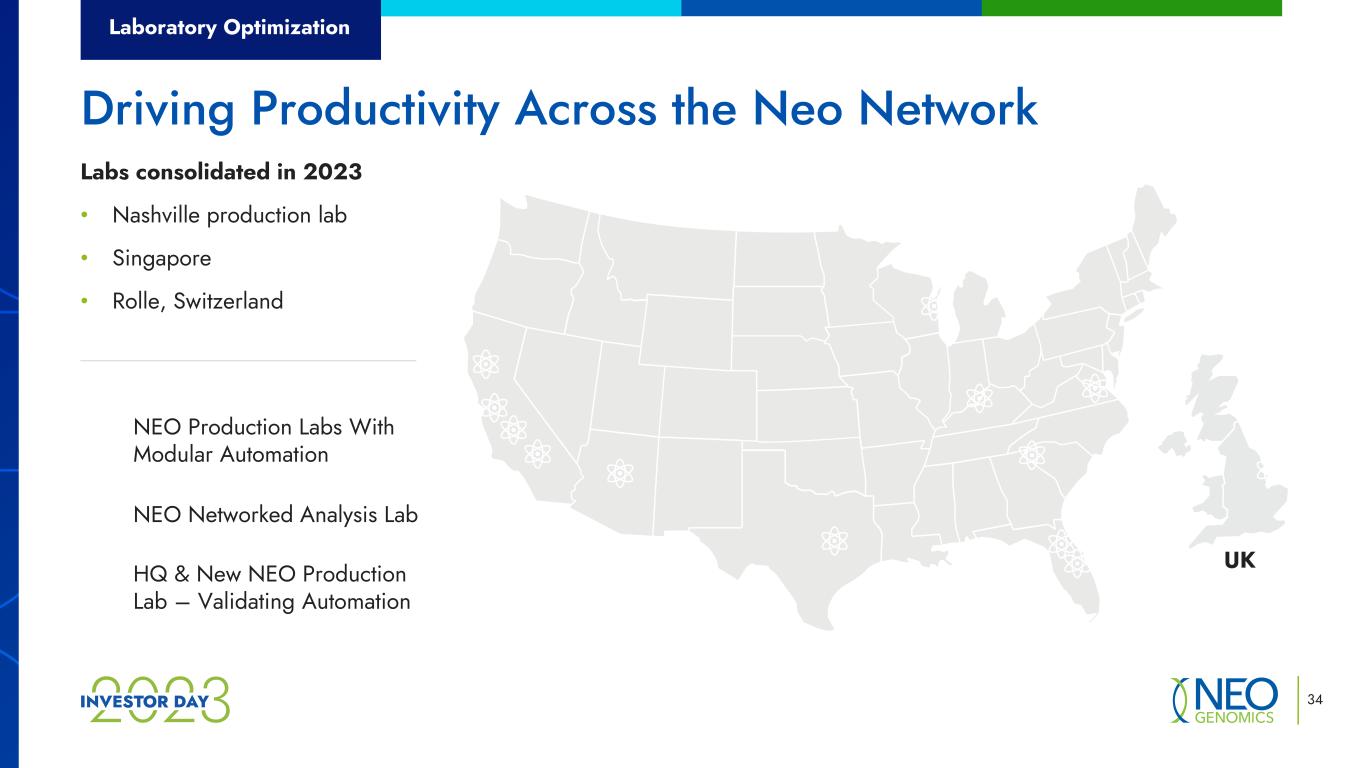
Laboratory Optimization 34 Driving Productivity Across the Neo Network Labs consolidated in 2023 • Nashville production lab • Singapore • Rolle, Switzerland UK NEO Production Labs With Modular Automation NEO Networked Analysis Lab HQ & New NEO Production Lab – Validating Automation
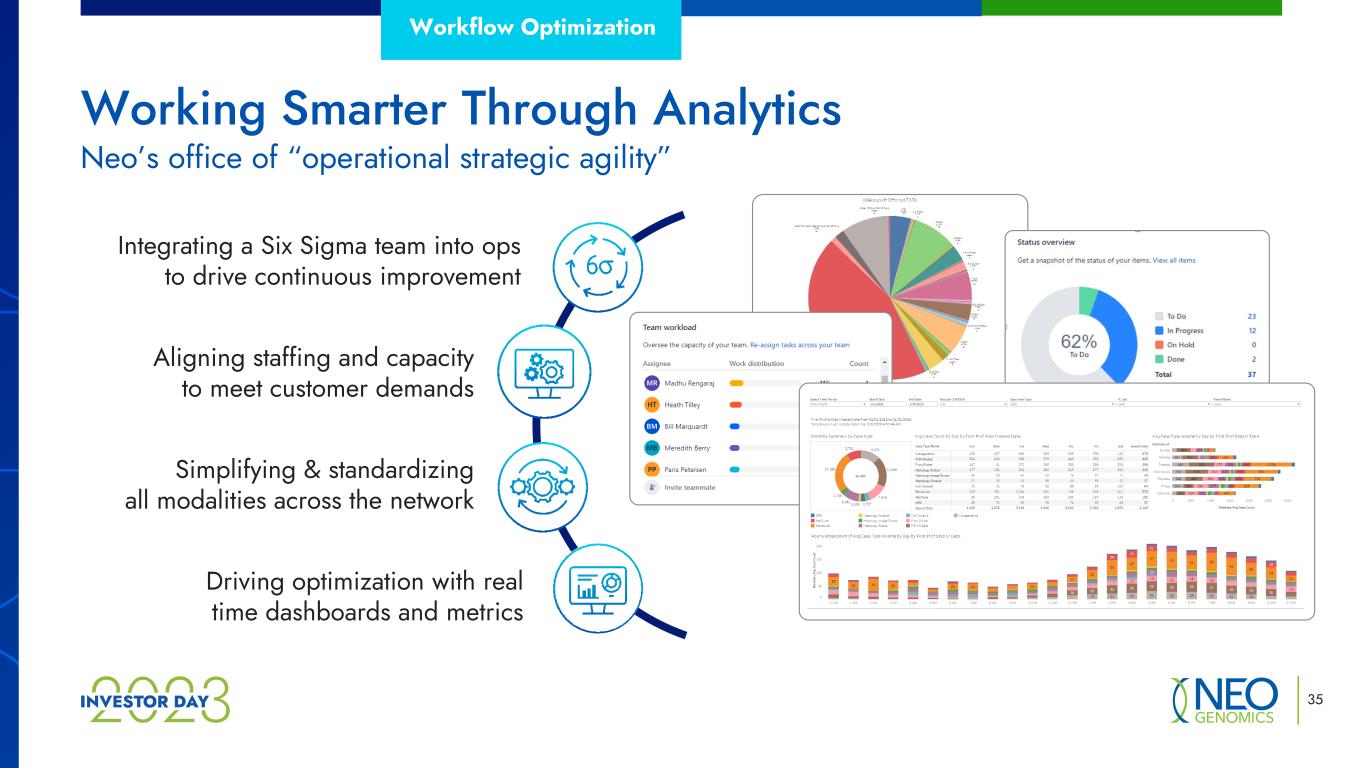
35 Working Smarter Through Analytics Workflow Optimization Neo’s office of “operational strategic agility” Aligning staffing and capacity to meet customer demands Simplifying & standardizing all modalities across the network Integrating a Six Sigma team into ops to drive continuous improvement Driving optimization with real time dashboards and metrics
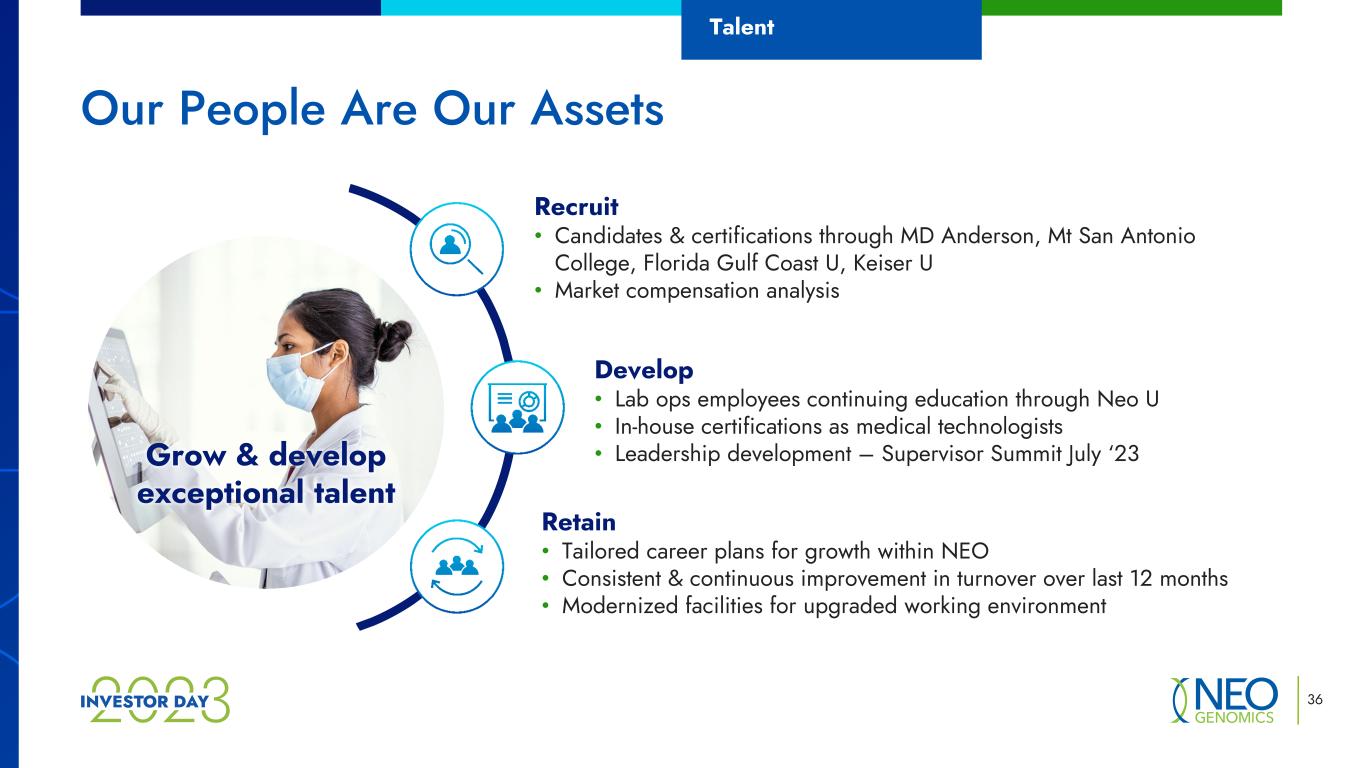
36 Our People Are Our Assets Talent Recruit • Candidates & certifications through MD Anderson, Mt San Antonio College, Florida Gulf Coast U, Keiser U • Market compensation analysis Grow & develop exceptional talent Develop • Lab ops employees continuing education through Neo U • In-house certifications as medical technologists • Leadership development – Supervisor Summit July ‘23 Retain • Tailored career plans for growth within NEO • Consistent & continuous improvement in turnover over last 12 months • Modernized facilities for upgraded working environment

37 Digital Transformation
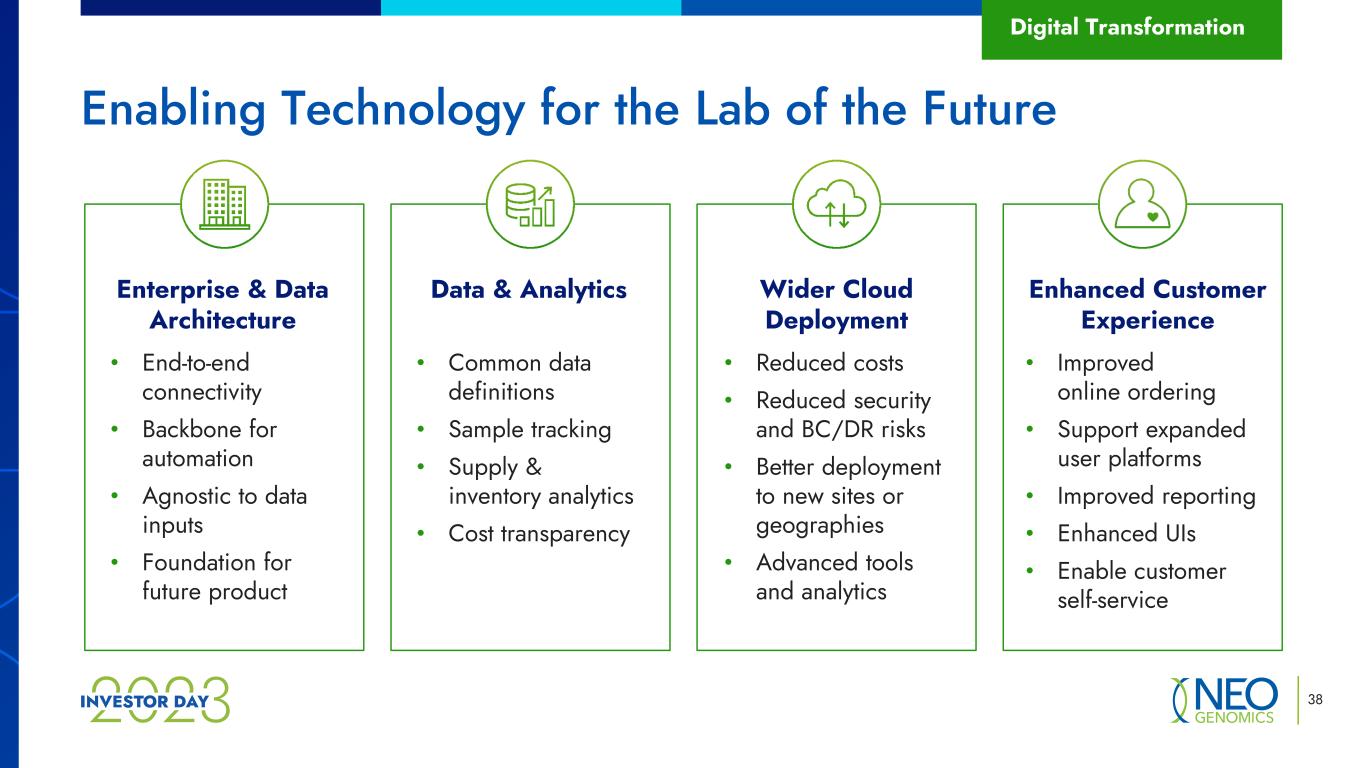
38 Enabling Technology for the Lab of the Future Digital Transformation Enterprise & Data Architecture Data & Analytics Wider Cloud Deployment Enhanced Customer Experience • End-to-end connectivity • Backbone for automation • Agnostic to data inputs • Foundation for future product • Common data definitions • Sample tracking • Supply & inventory analytics • Cost transparency • Reduced costs • Reduced security and BC/DR risks • Better deployment to new sites or geographies • Advanced tools and analytics • Improved online ordering • Support expanded user platforms • Improved reporting • Enhanced UIs • Enable customer self-service
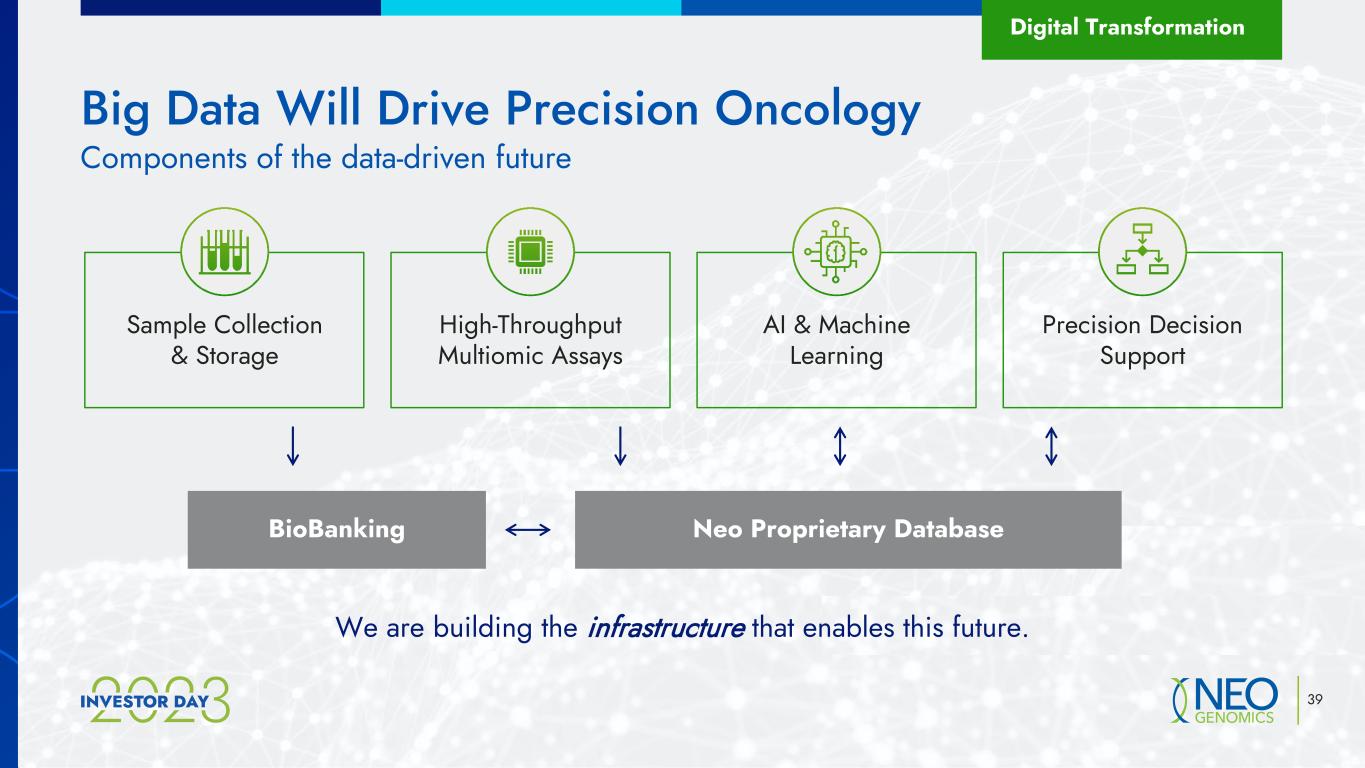
39 Big Data Will Drive Precision Oncology Digital Transformation Components of the data-driven future Sample Collection & Storage High-Throughput Multiomic Assays AI & Machine Learning Precision Decision Support Neo Proprietary DatabaseBioBanking We are building the infrastructure that enables this future.
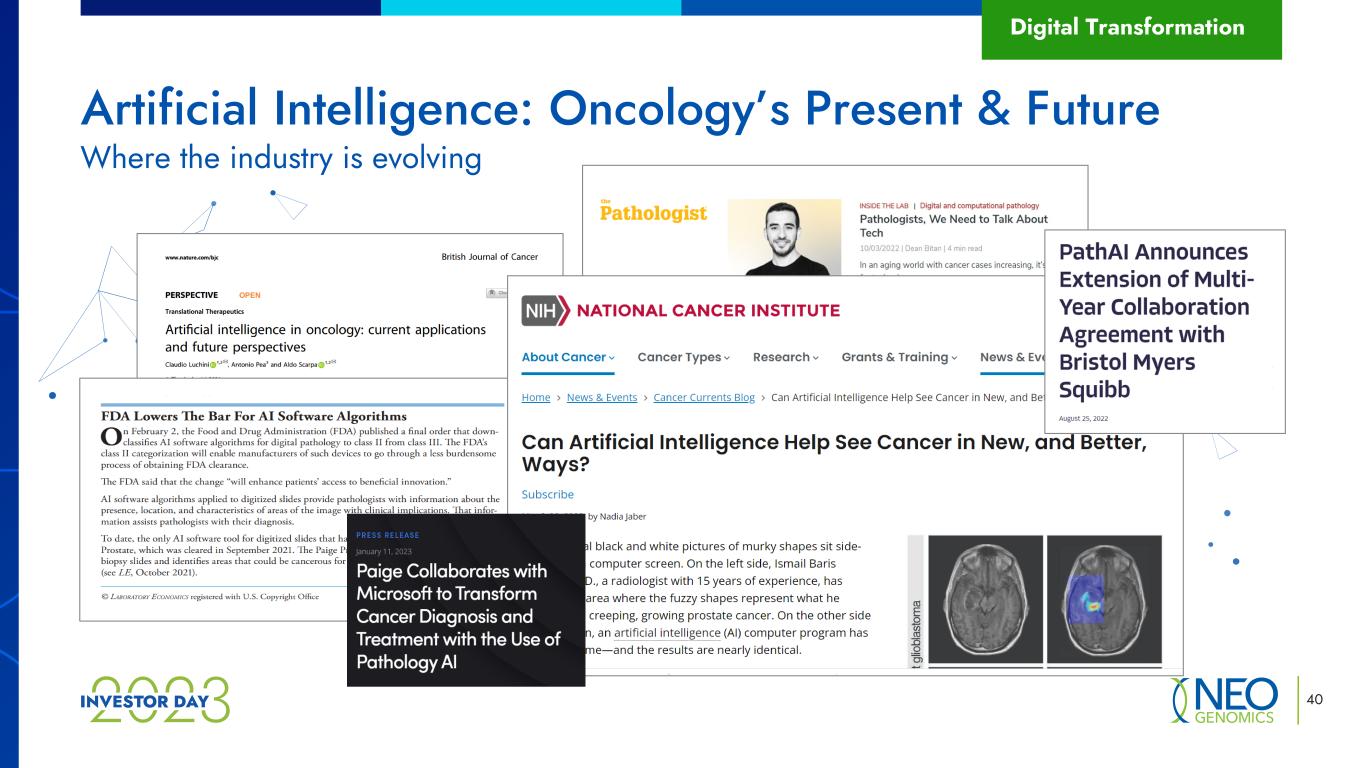
40 Artificial Intelligence: Oncology’s Present & Future Digital Transformation Where the industry is evolving
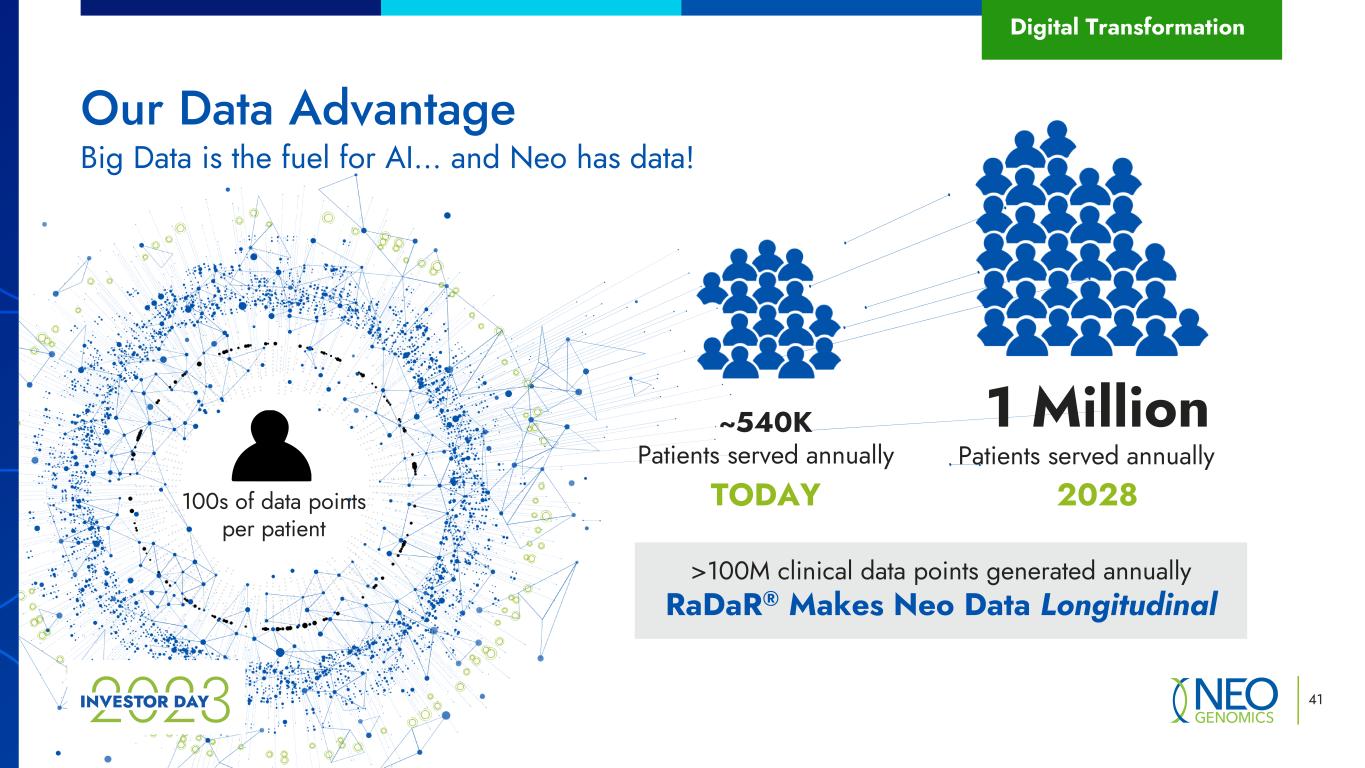
~540K Patients served annually 41 Our Data Advantage Big Data is the fuel for AI… and Neo has data! Patients served annually 1 Million Digital Transformation 100s of data points per patient 2028TODAY >100M clinical data points generated annually RaDaR® Makes Neo Data Longitudinal
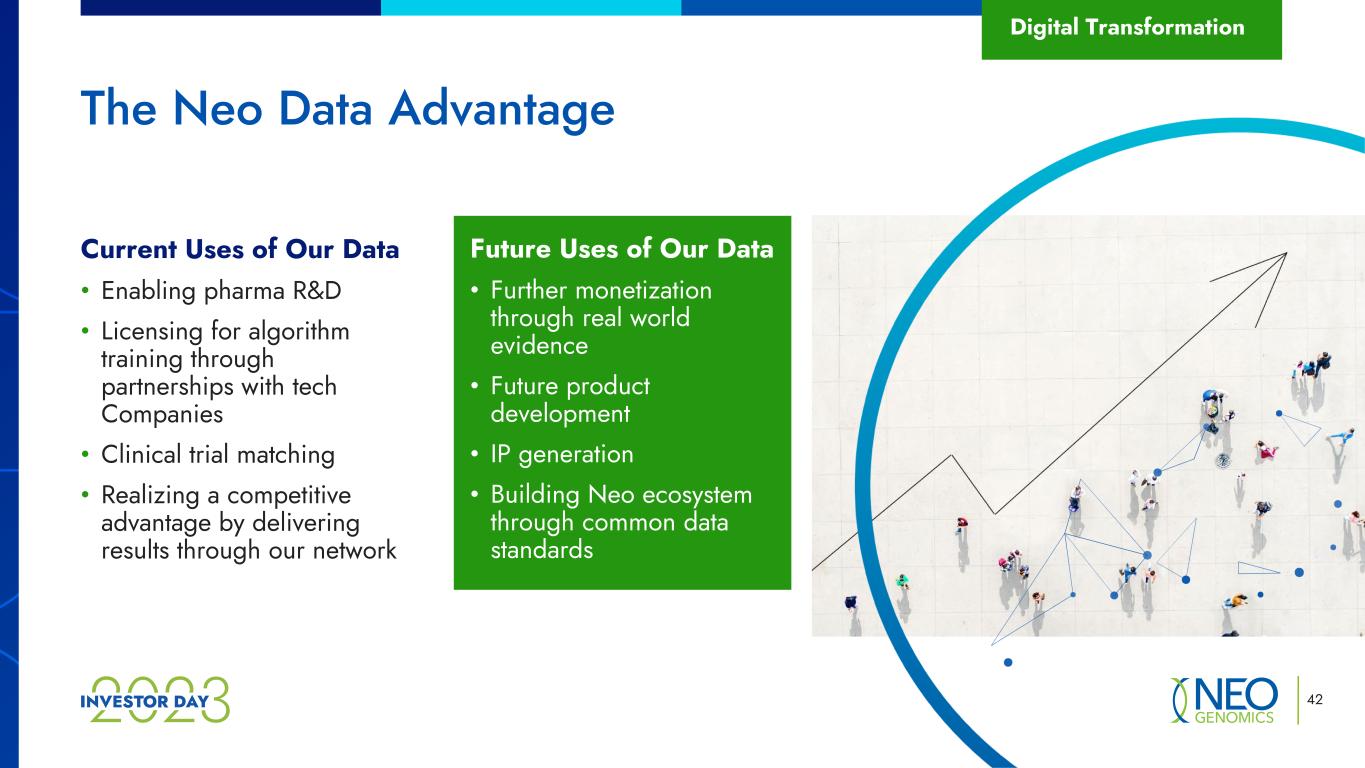
42 The Neo Data Advantage Digital Transformation Current Uses of Our Data • Enabling pharma R&D • Licensing for algorithm training through partnerships with tech Companies • Clinical trial matching • Realizing a competitive advantage by delivering results through our network Future Uses of Our Data • Further monetization through real world evidence • Future product development • IP generation • Building Neo ecosystem through common data standards
43 Key Takeaways We will continue to drive results in 2023 through: • Lab optimization • Workflow analysis & optimization • Talent recruitment & retention We are delivering strong results in improvements to turnaround time and productivity We have transitioned to a fully integrated operations model for end-to-end delivery1 2 3 We are undergoing a digital transformation to leverage Neo’s data advantage4

Innovating for the Future Vishal Sikri President, Advanced Diagnostics
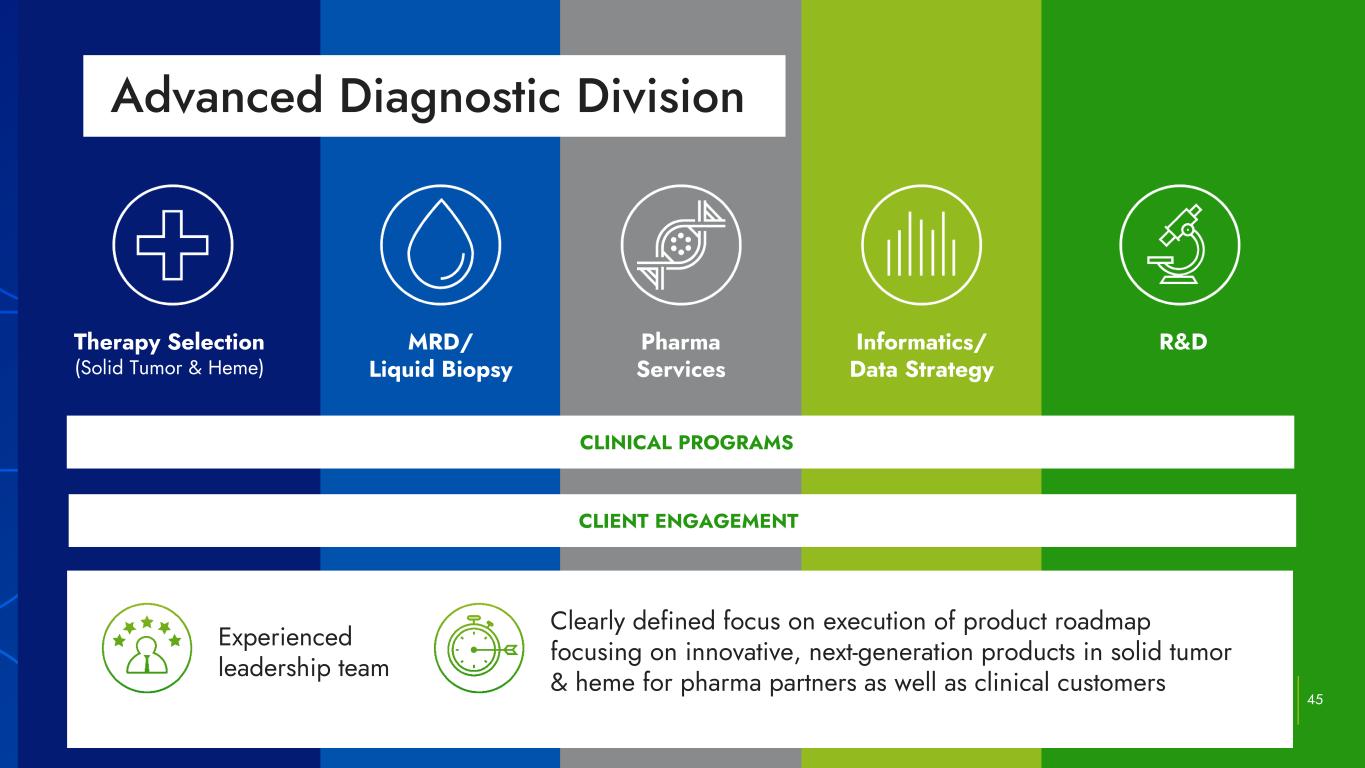
Therapy Selection (Solid Tumor & Heme) MRD/ Liquid Biopsy Pharma Services Informatics/ Data Strategy R&D Advanced Diagnostic Division 45 Clinical Programs Experienced leadership team CLINICAL PROGRAMS Clearly defined focus on execution of product roadmap focusing on innovative, next-generation products in solid tumor & heme for pharma partners as well as clinical customers CLIENT ENGAGEMENT
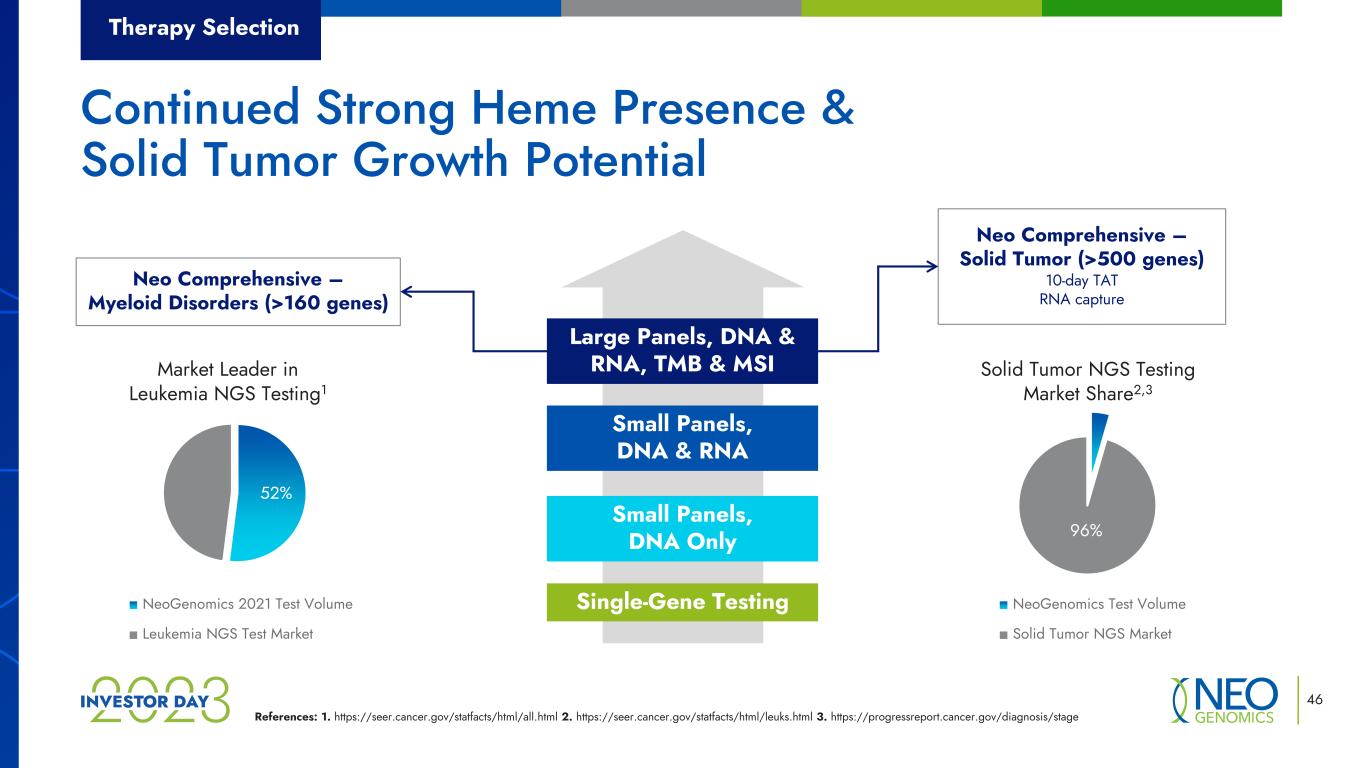
Market Leader in Leukemia NGS Testing1 NeoGenomics 2021 Test Volume Leukemia NGS Test Market Solid Tumor NGS Testing Market Share2,3 NeoGenomics Test Volume Solid Tumor NGS Market References: 1. https://seer.cancer.gov/statfacts/html/all.html 2. https://seer.cancer.gov/statfacts/html/leuks.html 3. https://progressreport.cancer.gov/diagnosis/stage 46 Neo Comprehensive – Myeloid Disorders (>160 genes) Neo Comprehensive – Solid Tumor (>500 genes) 10-day TAT RNA capture Therapy Selection Single-Gene Testing Small Panels, DNA Only Small Panels, DNA & RNA Large Panels, DNA & RNA, TMB & MSI Continued Strong Heme Presence & Solid Tumor Growth Potential 96% 52%
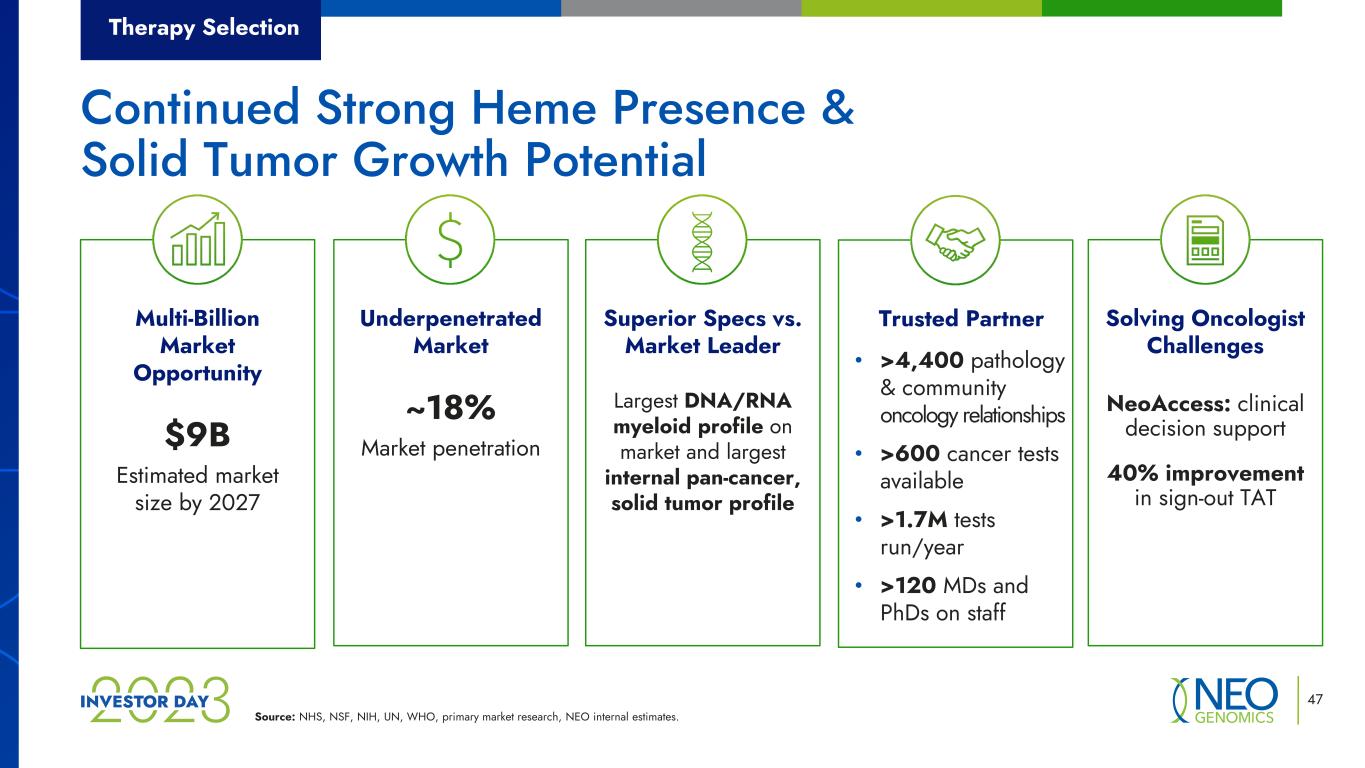
Source: NHS, NSF, NIH, UN, WHO, primary market research, NEO internal estimates. 47 Superior Specs vs. Market Leader Largest DNA/RNA myeloid profile on market and largest internal pan-cancer, solid tumor profile Trusted Partner • >4,400 pathology & community oncology relationships • >600 cancer tests available • >1.7M tests run/year • >120 MDs and PhDs on staff Solving Oncologist Challenges NeoAccess: clinical decision support 40% improvement in sign-out TAT Underpenetrated Market ~18% Market penetration Multi-Billion Market Opportunity $9B Estimated market size by 2027 Therapy Selection Continued Strong Heme Presence & Solid Tumor Growth Potential
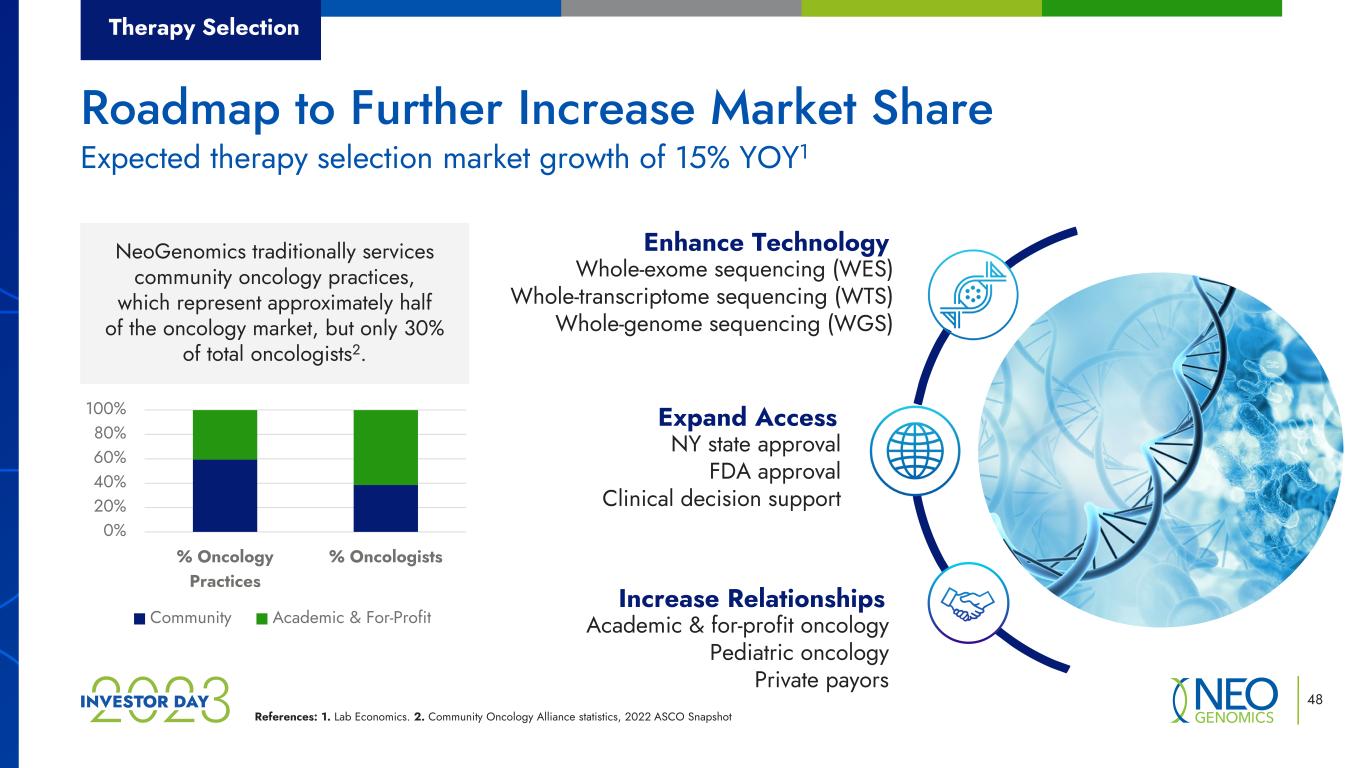
References: 1. Lab Economics. 2. Community Oncology Alliance statistics, 2022 ASCO Snapshot 48 NY state approval FDA approval Clinical decision support Expand Access Academic & for-profit oncology Pediatric oncology Private payors Increase Relationships Whole-exome sequencing (WES) Whole-transcriptome sequencing (WTS) Whole-genome sequencing (WGS) Enhance TechnologyNeoGenomics traditionally services community oncology practices, which represent approximately half of the oncology market, but only 30% of total oncologists2. 0% 20% 40% 60% 80% 100% % Oncology Practices % Oncologists Community Academic & For-Profit Therapy Selection Expected therapy selection market growth of 15% YOY1 Roadmap to Further Increase Market Share
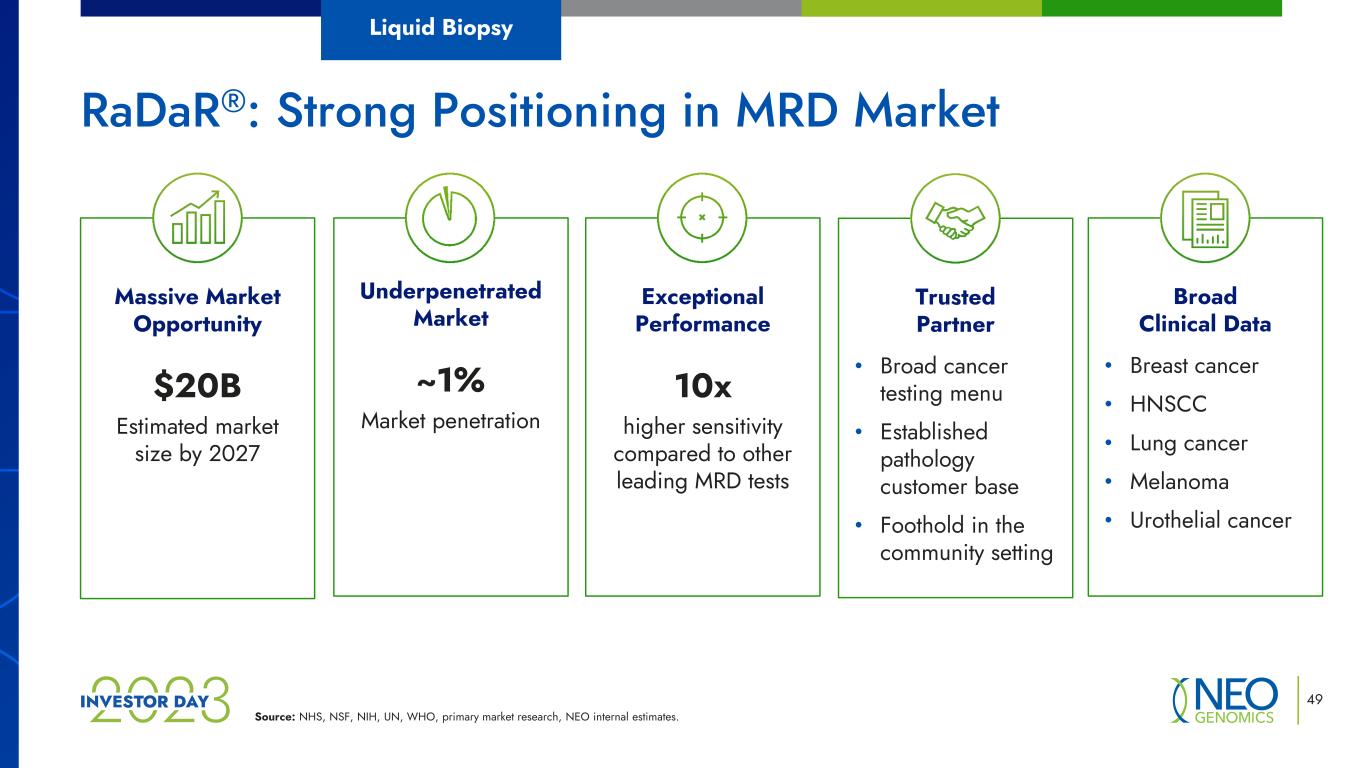
Source: NHS, NSF, NIH, UN, WHO, primary market research, NEO internal estimates. 49 Liquid Biopsy Exceptional Performance 10x higher sensitivity compared to other leading MRD tests Trusted Partner • Broad cancer testing menu • Established pathology customer base • Foothold in the community setting Broad Clinical Data • Breast cancer • HNSCC • Lung cancer • Melanoma • Urothelial cancer Underpenetrated Market ~1% Market penetration Massive Market Opportunity $20B Estimated market size by 2027 RaDaR®: Strong Positioning in MRD Market
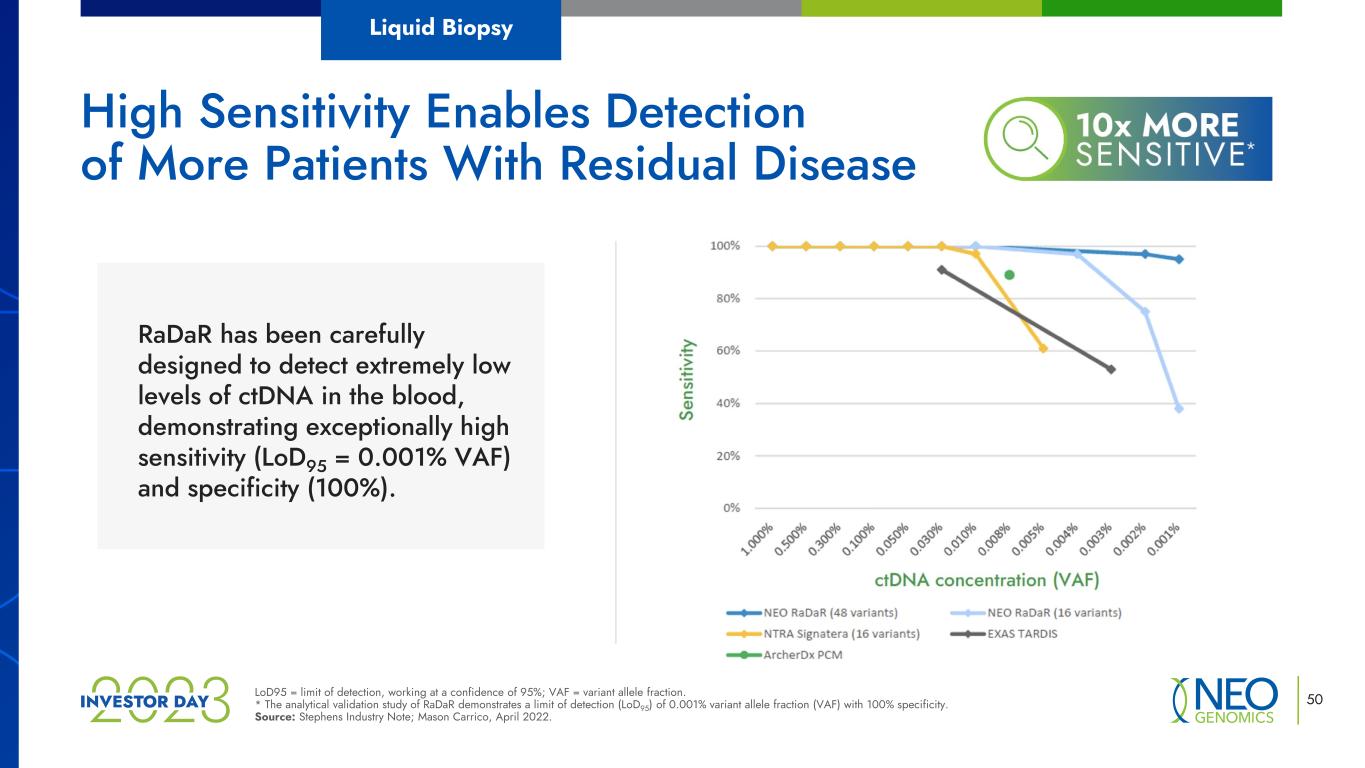
50LoD95 = limit of detection, working at a confidence of 95%; VAF = variant allele fraction. * The analytical validation study of RaDaR demonstrates a limit of detection (LoD95) of 0.001% variant allele fraction (VAF) with 100% specificity. Source: Stephens Industry Note; Mason Carrico, April 2022. High Sensitivity Enables Detection of More Patients With Residual Disease RaDaR has been carefully designed to detect extremely low levels of ctDNA in the blood, demonstrating exceptionally high sensitivity (LoD95 = 0.001% VAF) and specificity (100%). Liquid Biopsy
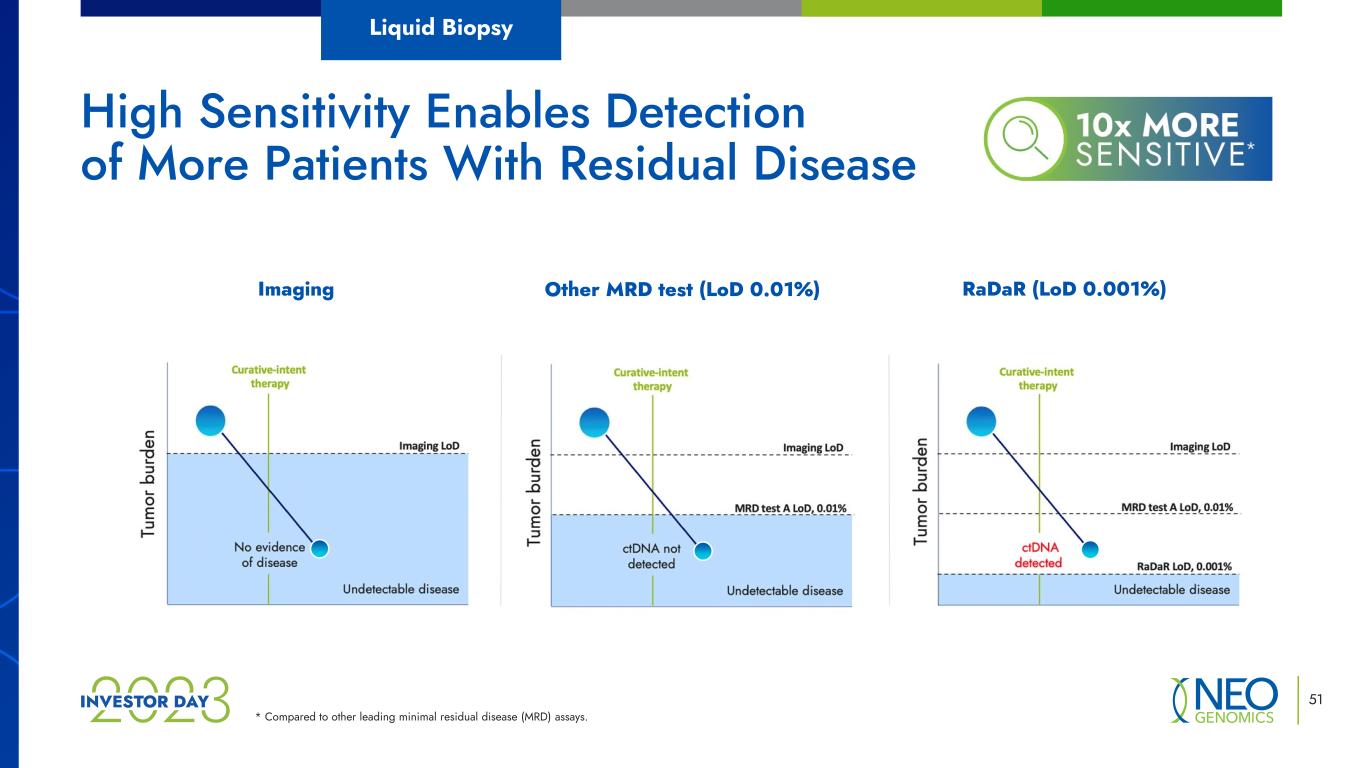
RaDaR (LoD 0.001%) 51 * Compared to other leading minimal residual disease (MRD) assays. High Sensitivity Enables Detection of More Patients With Residual Disease Liquid Biopsy Other MRD test (LoD 0.01%)Imaging
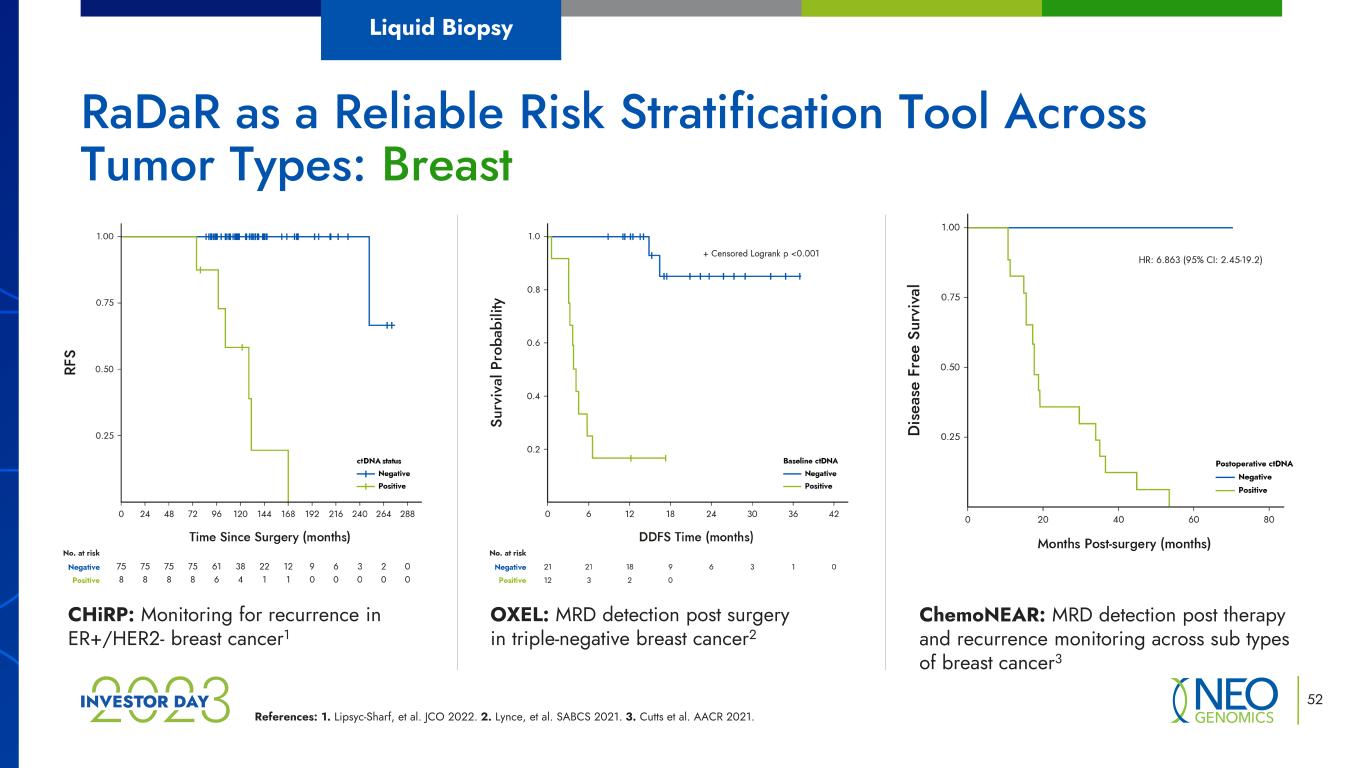
References: 1. Lipsyc-Sharf, et al. JCO 2022. 2. Lynce, et al. SABCS 2021. 3. Cutts et al. AACR 2021. RaDaR as a Reliable Risk Stratification Tool Across Tumor Types: Breast CHiRP: Monitoring for recurrence in ER+/HER2- breast cancer1 OXEL: MRD detection post surgery in triple-negative breast cancer2 ChemoNEAR: MRD detection post therapy and recurrence monitoring across sub types of breast cancer3 Liquid Biopsy 52
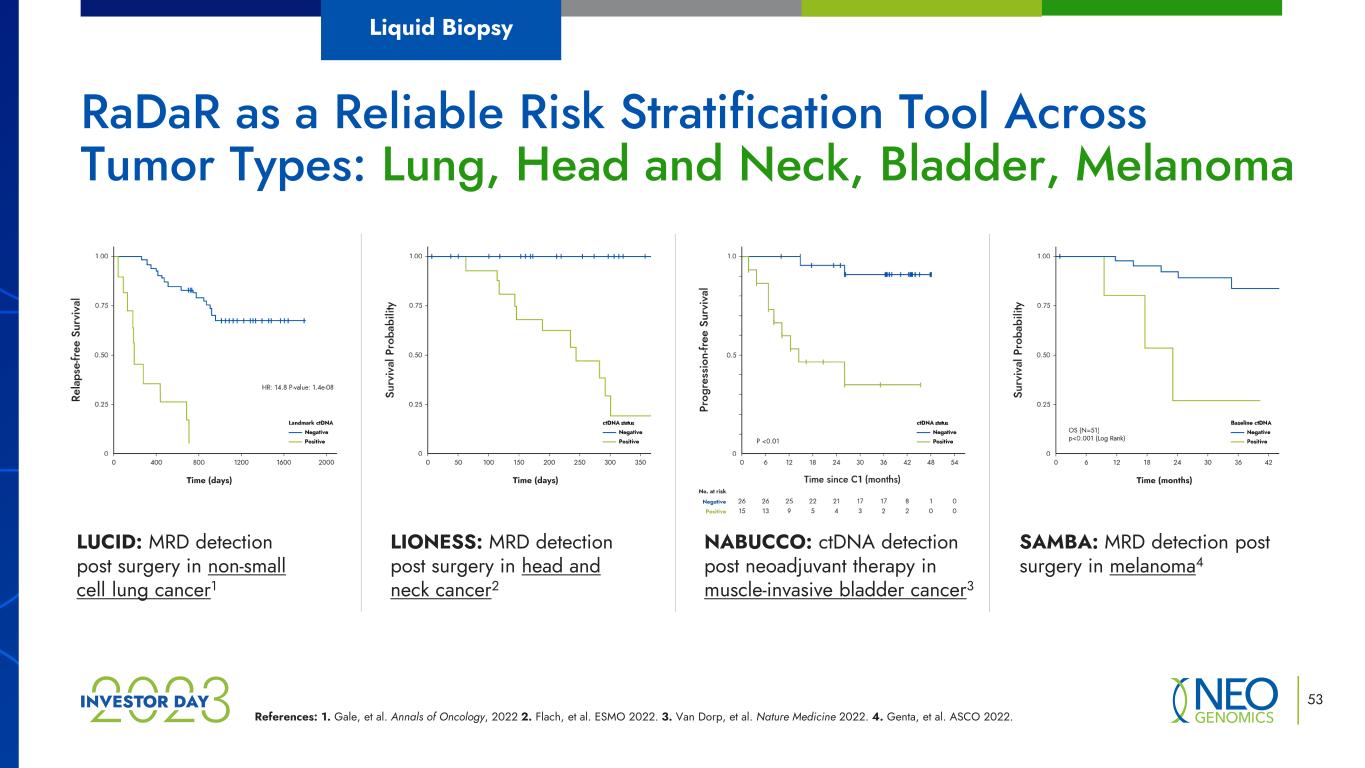
References: 1. Gale, et al. Annals of Oncology, 2022 2. Flach, et al. ESMO 2022. 3. Van Dorp, et al. Nature Medicine 2022. 4. Genta, et al. ASCO 2022. LUCID: MRD detection post surgery in non-small cell lung cancer1 LIONESS: MRD detection post surgery in head and neck cancer2 NABUCCO: ctDNA detection post neoadjuvant therapy in muscle-invasive bladder cancer3 SAMBA: MRD detection post surgery in melanoma4 RaDaR as a Reliable Risk Stratification Tool Across Tumor Types: Lung, Head and Neck, Bladder, Melanoma Liquid Biopsy 53 Time (days) (days) Time (months)Time (days)
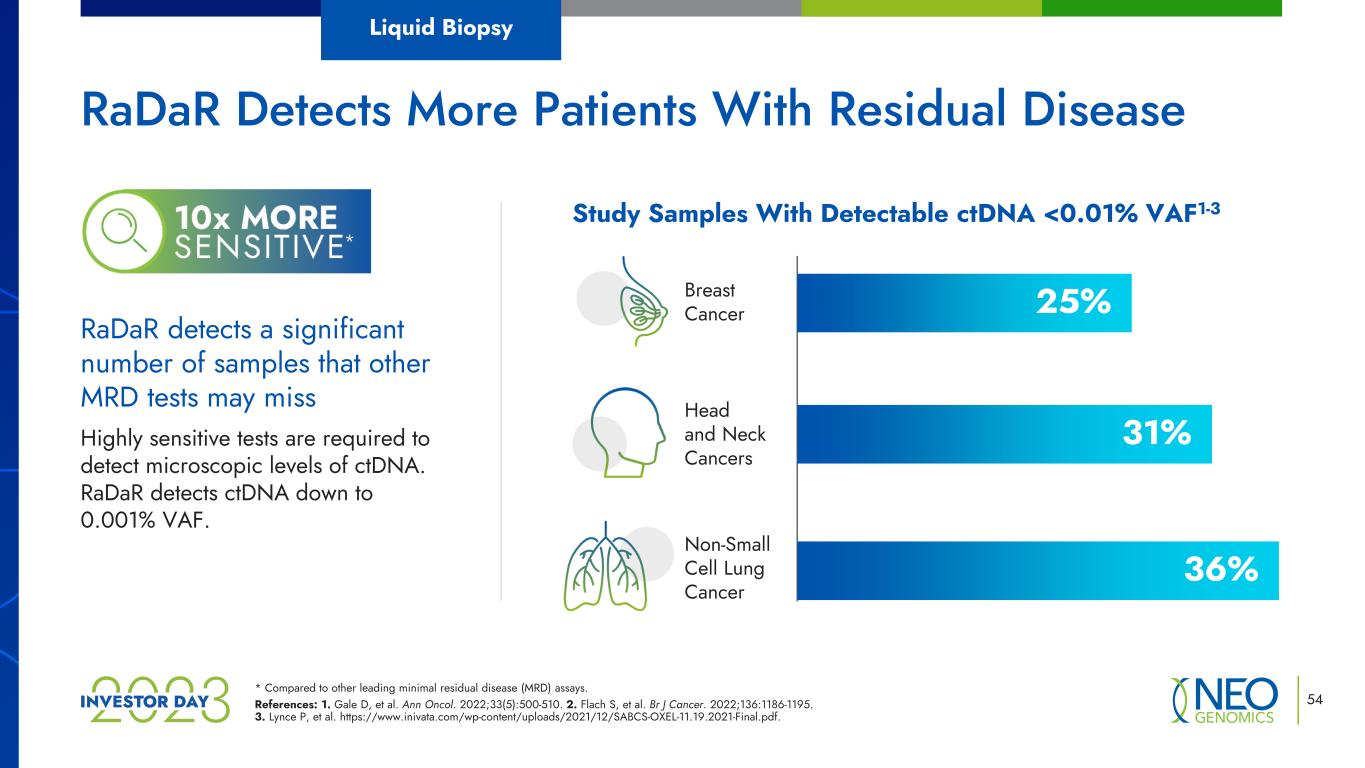
* Compared to other leading minimal residual disease (MRD) assays. References: 1. Gale D, et al. Ann Oncol. 2022;33(5):500-510. 2. Flach S, et al. Br J Cancer. 2022;136:1186-1195. 3. Lynce P, et al. https://www.inivata.com/wp-content/uploads/2021/12/SABCS-OXEL-11.19.2021-Final.pdf. 54 RaDaR detects a significant number of samples that other MRD tests may miss Highly sensitive tests are required to detect microscopic levels of ctDNA. RaDaR detects ctDNA down to 0.001% VAF. Study Samples With Detectable ctDNA <0.01% VAF1-3 Breast Cancer Non-Small Cell Lung Cancer Head and Neck Cancers 25% 36% 31% RaDaR Detects More Patients With Residual Disease Liquid Biopsy
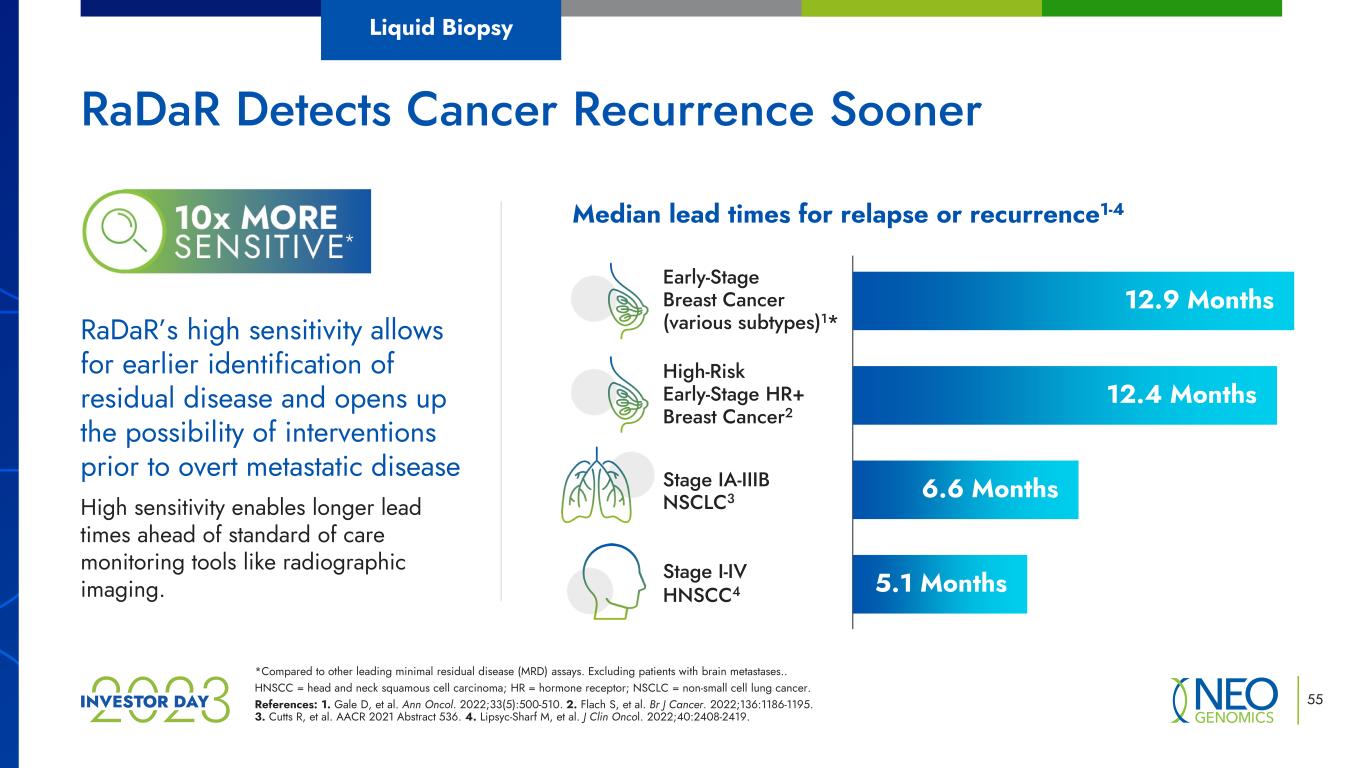
*Compared to other leading minimal residual disease (MRD) assays. Excluding patients with brain metastases.. HNSCC = head and neck squamous cell carcinoma; HR = hormone receptor; NSCLC = non-small cell lung cancer. References: 1. Gale D, et al. Ann Oncol. 2022;33(5):500-510. 2. Flach S, et al. Br J Cancer. 2022;136:1186-1195. 3. Cutts R, et al. AACR 2021 Abstract 536. 4. Lipsyc-Sharf M, et al. J Clin Oncol. 2022;40:2408-2419. 55 RaDaR’s high sensitivity allows for earlier identification of residual disease and opens up the possibility of interventions prior to overt metastatic disease High sensitivity enables longer lead times ahead of standard of care monitoring tools like radiographic imaging. Median lead times for relapse or recurrence1-4 Early-Stage Breast Cancer (various subtypes)1* Stage IA-IIIB NSCLC3 Stage I-IV HNSCC4 12.9 Months 12.4 Months 5.1 Months 6.6 Months High-Risk Early-Stage HR+ Breast Cancer2 RaDaR Detects Cancer Recurrence Sooner Liquid Biopsy
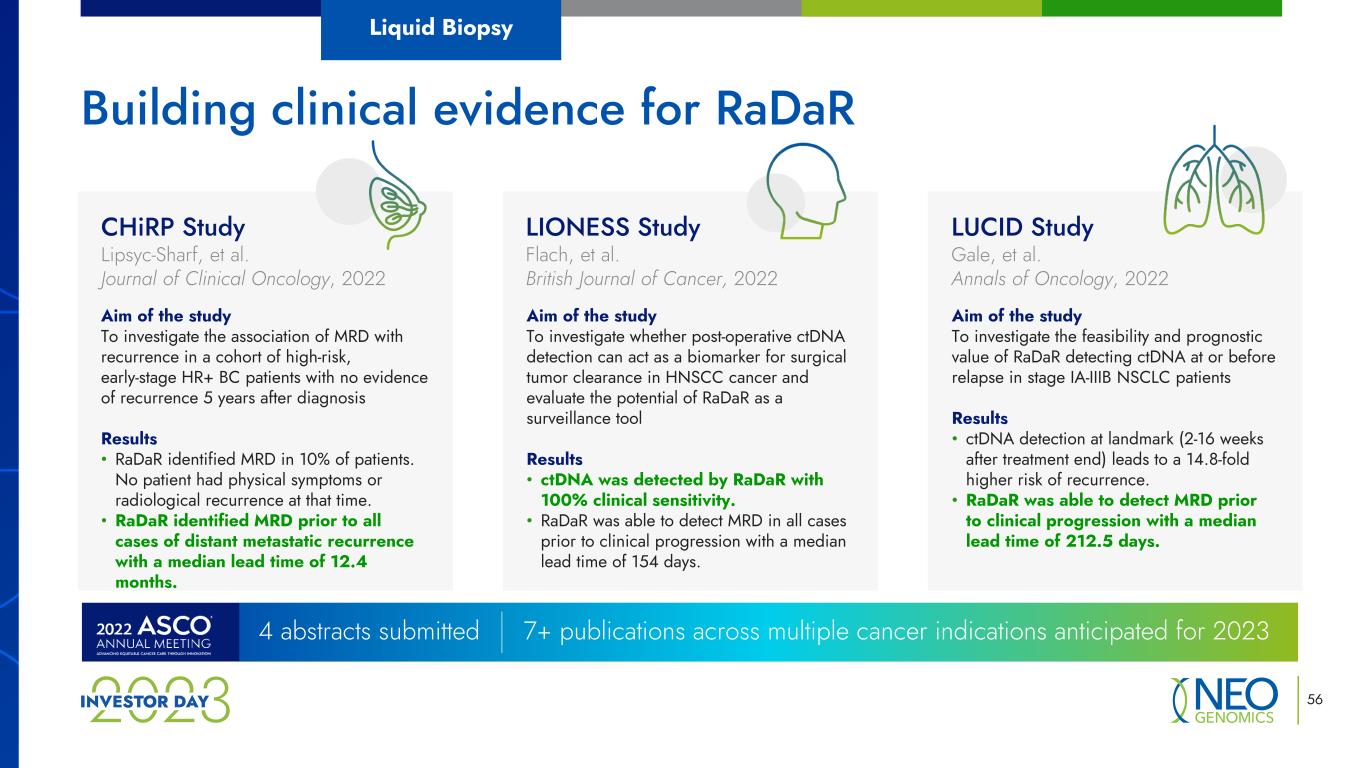
56 Building clinical evidence for RaDaR 4 abstracts submitted 7+ publications across multiple cancer indications anticipated for 2023 Liquid Biopsy CHiRP Study Lipsyc-Sharf, et al. Journal of Clinical Oncology, 2022 Aim of the study To investigate the association of MRD with recurrence in a cohort of high-risk, early-stage HR+ BC patients with no evidence of recurrence 5 years after diagnosis Results • RaDaR identified MRD in 10% of patients. No patient had physical symptoms or radiological recurrence at that time. • RaDaR identified MRD prior to all cases of distant metastatic recurrence with a median lead time of 12.4 months. LIONESS Study Flach, et al. British Journal of Cancer, 2022 Aim of the study To investigate whether post-operative ctDNA detection can act as a biomarker for surgical tumor clearance in HNSCC cancer and evaluate the potential of RaDaR as a surveillance tool Results • ctDNA was detected by RaDaR with 100% clinical sensitivity. • RaDaR was able to detect MRD in all cases prior to clinical progression with a median lead time of 154 days. Aim of the study To investigate the feasibility and prognostic value of RaDaR detecting ctDNA at or before relapse in stage IA-IIIB NSCLC patients Results • ctDNA detection at landmark (2-16 weeks after treatment end) leads to a 14.8-fold higher risk of recurrence. • RaDaR was able to detect MRD prior to clinical progression with a median lead time of 212.5 days. LUCID Study Gale, et al. Annals of Oncology, 2022
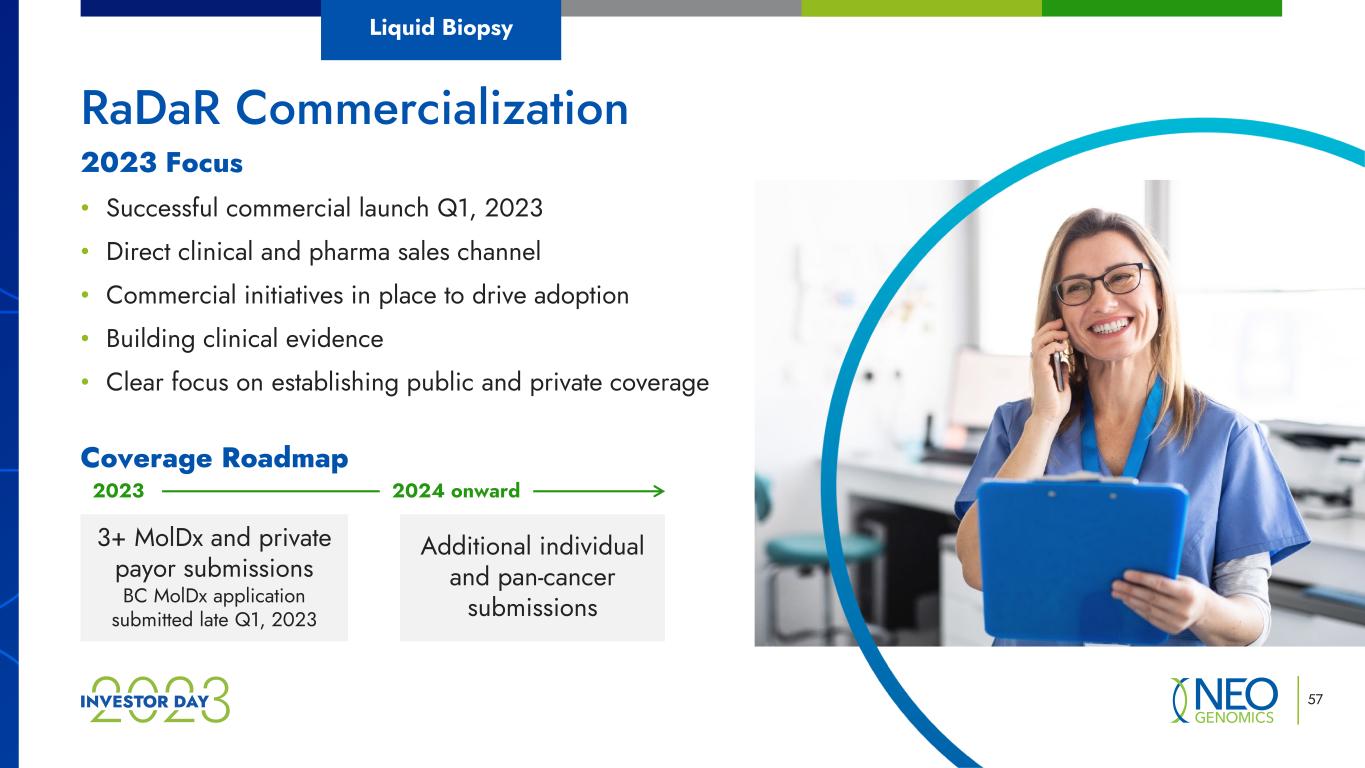
57 2023 2024 onward 3+ MolDx and private payor submissions BC MolDx application submitted late Q1, 2023 Additional individual and pan-cancer submissions RaDaR Commercialization 2023 Focus • Successful commercial launch Q1, 2023 • Direct clinical and pharma sales channel • Commercial initiatives in place to drive adoption • Building clinical evidence • Clear focus on establishing public and private coverage Coverage Roadmap Liquid Biopsy
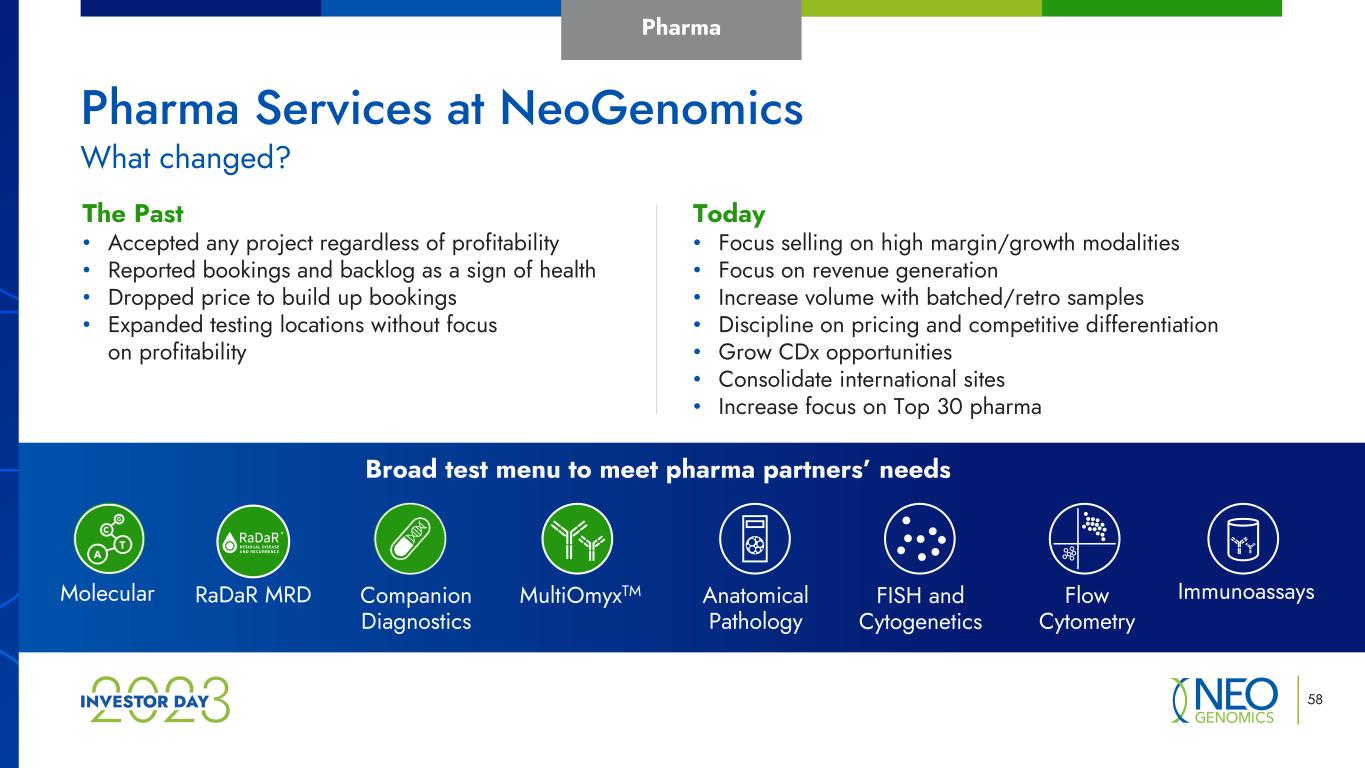
58 Pharma Today • Focus selling on high margin/growth modalities • Focus on revenue generation • Increase volume with batched/retro samples • Discipline on pricing and competitive differentiation • Grow CDx opportunities • Consolidate international sites • Increase focus on Top 30 pharma The Past • Accepted any project regardless of profitability • Reported bookings and backlog as a sign of health • Dropped price to build up bookings • Expanded testing locations without focus on profitability Broad test menu to meet pharma partners’ needs MultiOmyxTM Anatomical Pathology FISH and Cytogenetics Flow Cytometry ImmunoassaysMolecular Companion Diagnostics What changed? Pharma Services at NeoGenomics RaDaR MRD
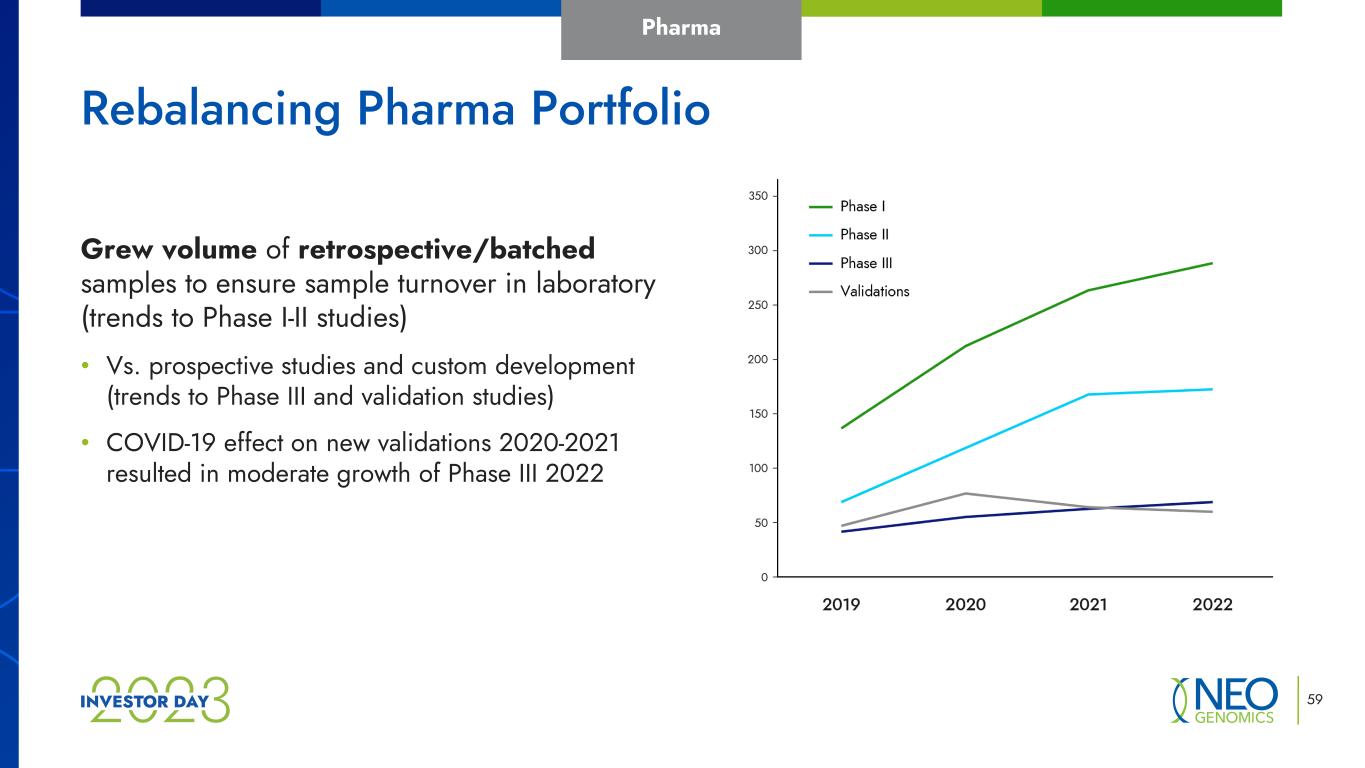
59 Rebalancing Pharma Portfolio Grew volume of retrospective/batched samples to ensure sample turnover in laboratory (trends to Phase I-II studies) • Vs. prospective studies and custom development (trends to Phase III and validation studies) • COVID-19 effect on new validations 2020-2021 resulted in moderate growth of Phase III 2022 Pharma
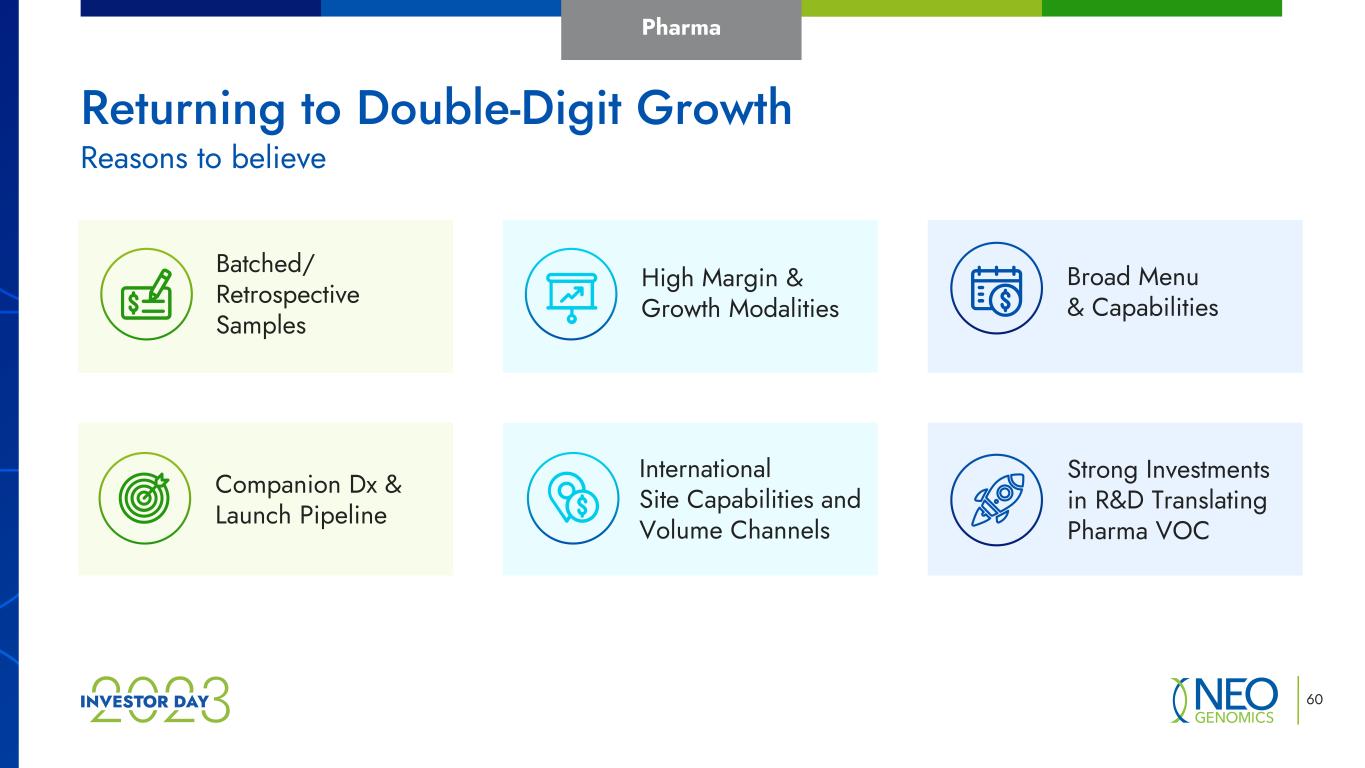
60 Returning to Double-Digit Growth Reasons to believe International Site Capabilities and Volume Channels High Margin & Growth Modalities Companion Dx & Launch Pipeline Strong Investments in R&D Translating Pharma VOC Batched/ Retrospective Samples Broad Menu & Capabilities Pharma
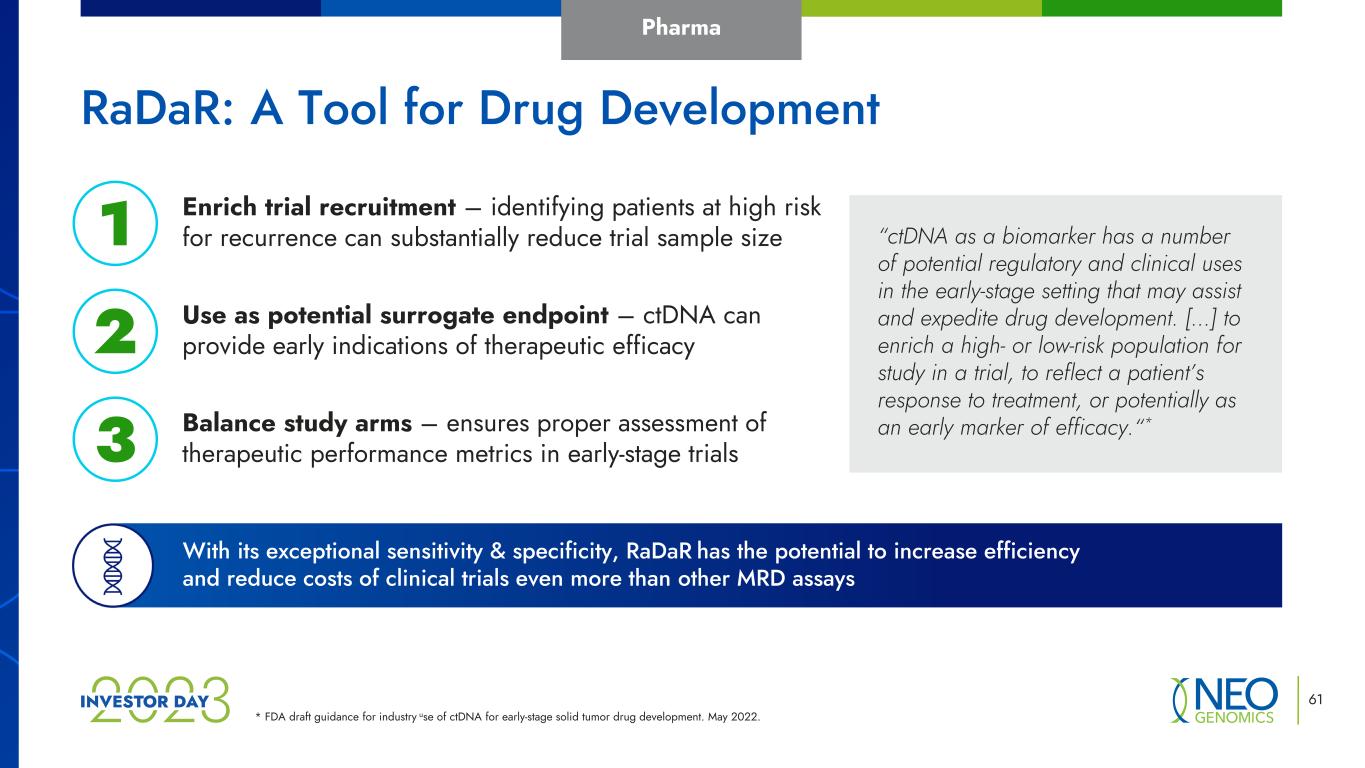
* FDA draft guidance for industry use of ctDNA for early-stage solid tumor drug development. May 2022. 61 Balance study arms – ensures proper assessment of therapeutic performance metrics in early-stage trials Use as potential surrogate endpoint – ctDNA can provide early indications of therapeutic efficacy Enrich trial recruitment – identifying patients at high risk for recurrence can substantially reduce trial sample size1 2 3 With its exceptional sensitivity & specificity, RaDaR has the potential to increase efficiency and reduce costs of clinical trials even more than other MRD assays “ctDNA as a biomarker has a number of potential regulatory and clinical uses in the early-stage setting that may assist and expedite drug development. […] to enrich a high- or low-risk population for study in a trial, to reflect a patient’s response to treatment, or potentially as an early marker of efficacy.“* RaDaR: A Tool for Drug Development Pharma
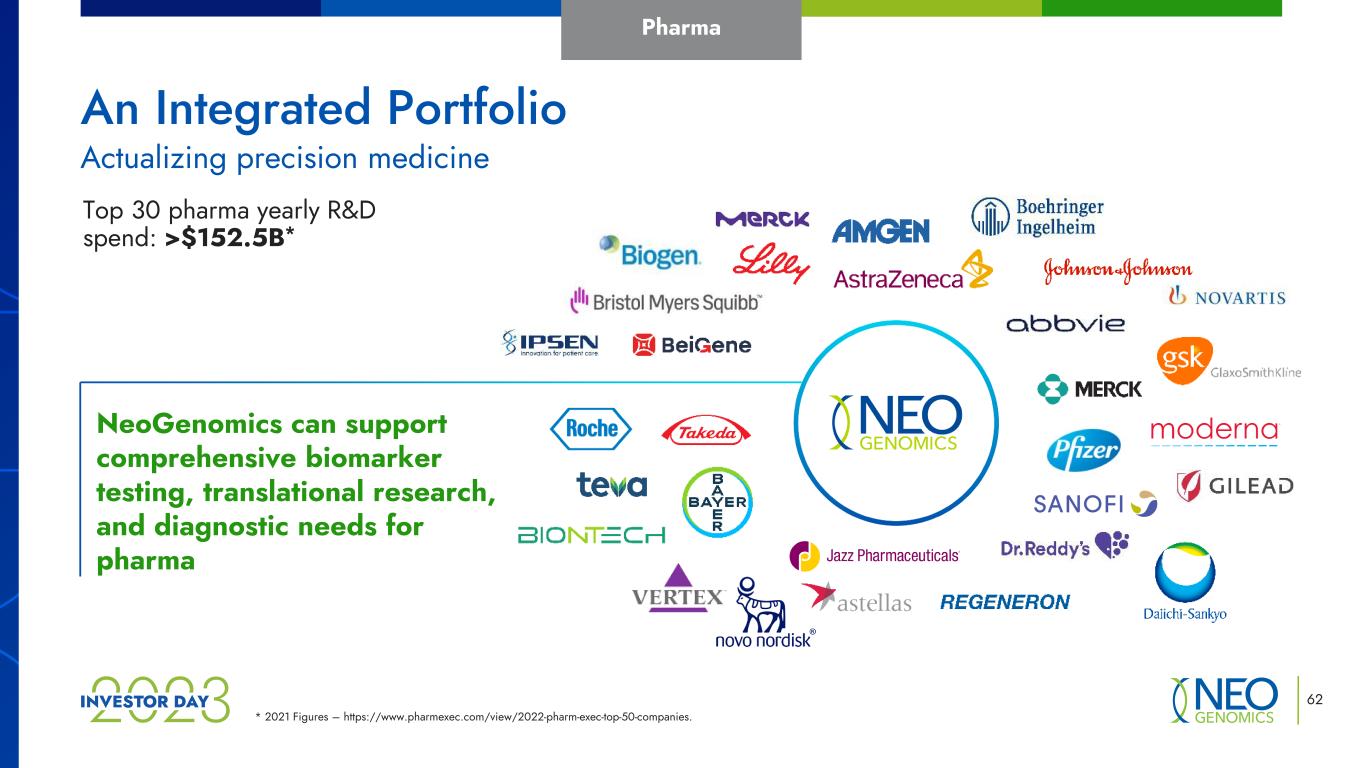
* 2021 Figures – https://www.pharmexec.com/view/2022-pharm-exec-top-50-companies. 62 An Integrated Portfolio Actualizing precision medicine Top 30 pharma yearly R&D spend: >$152.5B* NeoGenomics can support comprehensive biomarker testing, translational research, and diagnostic needs for pharma Pharma
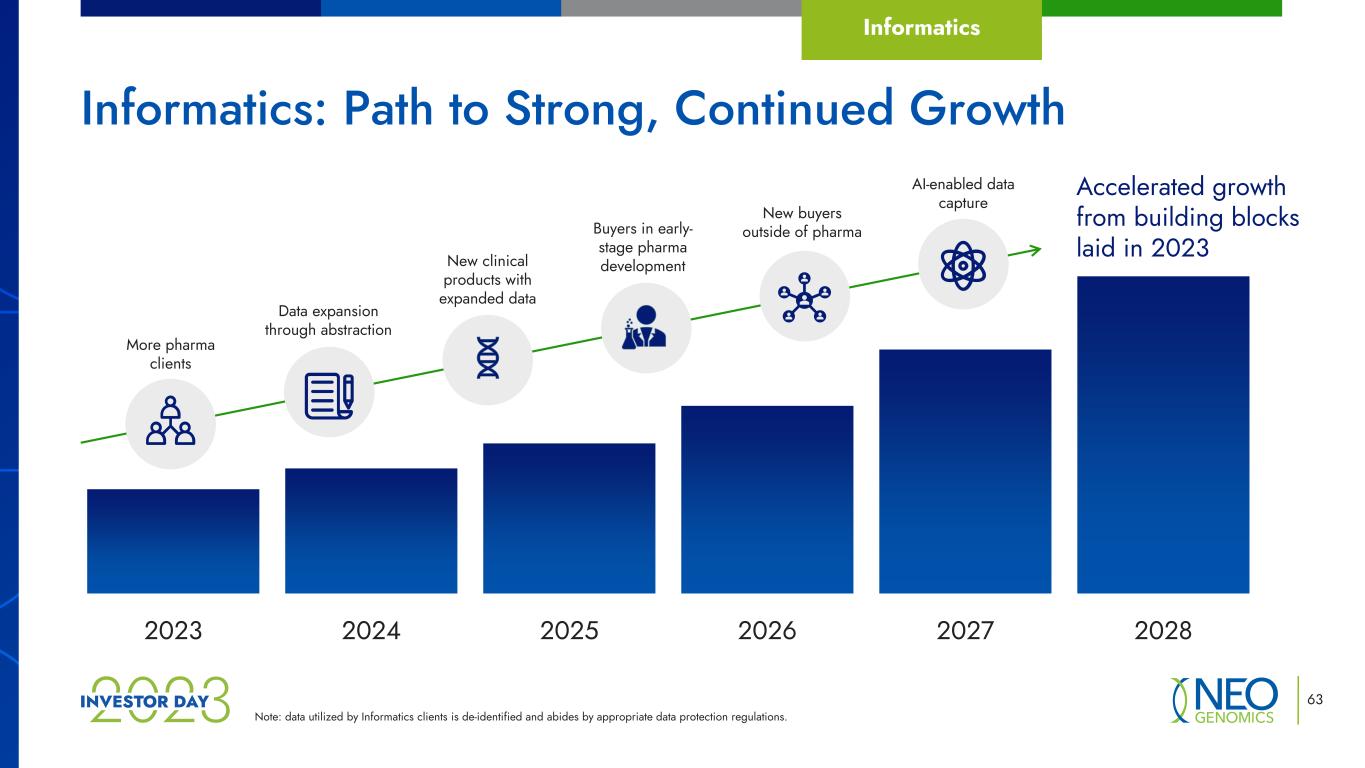
Note: data utilized by Informatics clients is de-identified and abides by appropriate data protection regulations. 63 Informatics: Path to Strong, Continued Growth 2023 2024 2025 2026 2027 2028 Accelerated growth from building blocks laid in 2023New clinical products with expanded data Data expansion through abstraction Buyers in early- stage pharma development AI-enabled data capture More pharma clients New buyers outside of pharma Informatics
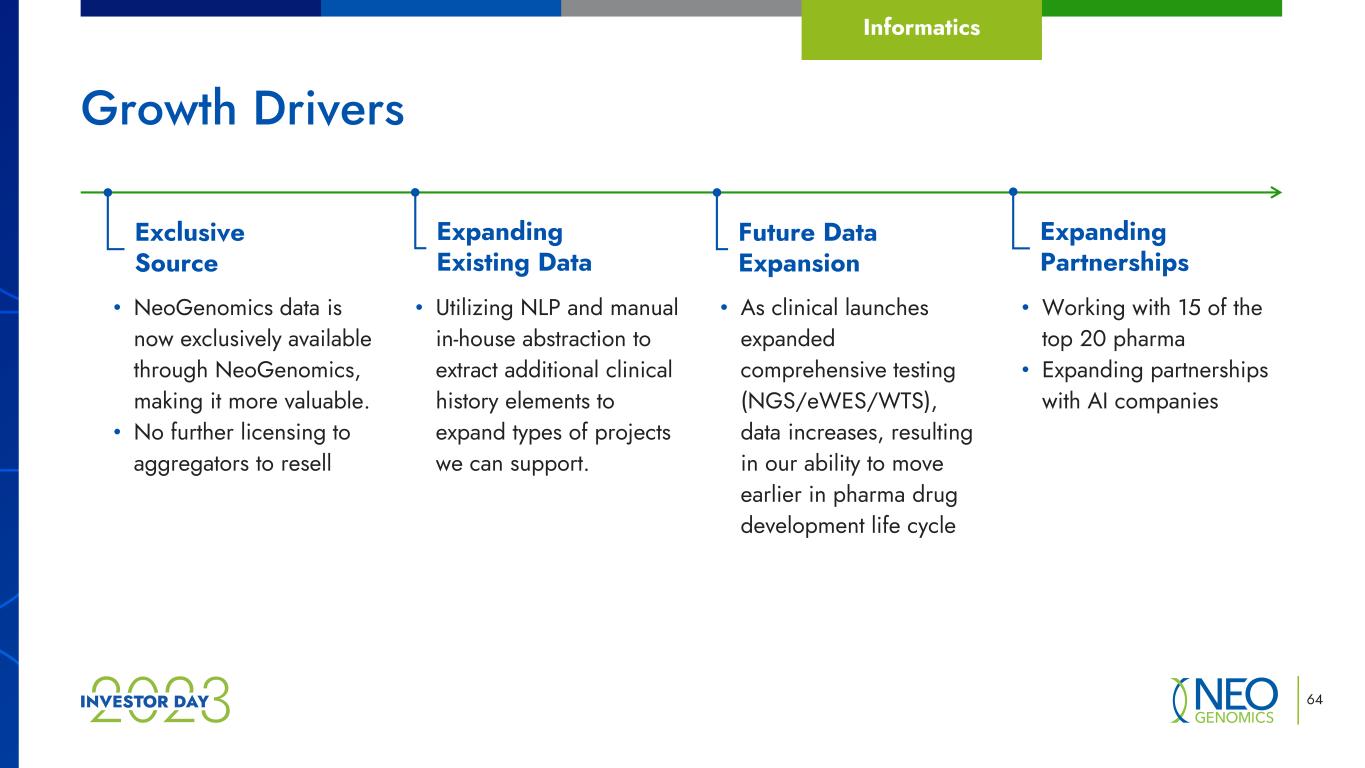
64 Growth Drivers Informatics Exclusive Source Expanding Existing Data Future Data Expansion Expanding Partnerships • Utilizing NLP and manual in-house abstraction to extract additional clinical history elements to expand types of projects we can support. • As clinical launches expanded comprehensive testing (NGS/eWES/WTS), data increases, resulting in our ability to move earlier in pharma drug development life cycle • NeoGenomics data is now exclusively available through NeoGenomics, making it more valuable. • No further licensing to aggregators to resell • Working with 15 of the top 20 pharma • Expanding partnerships with AI companies
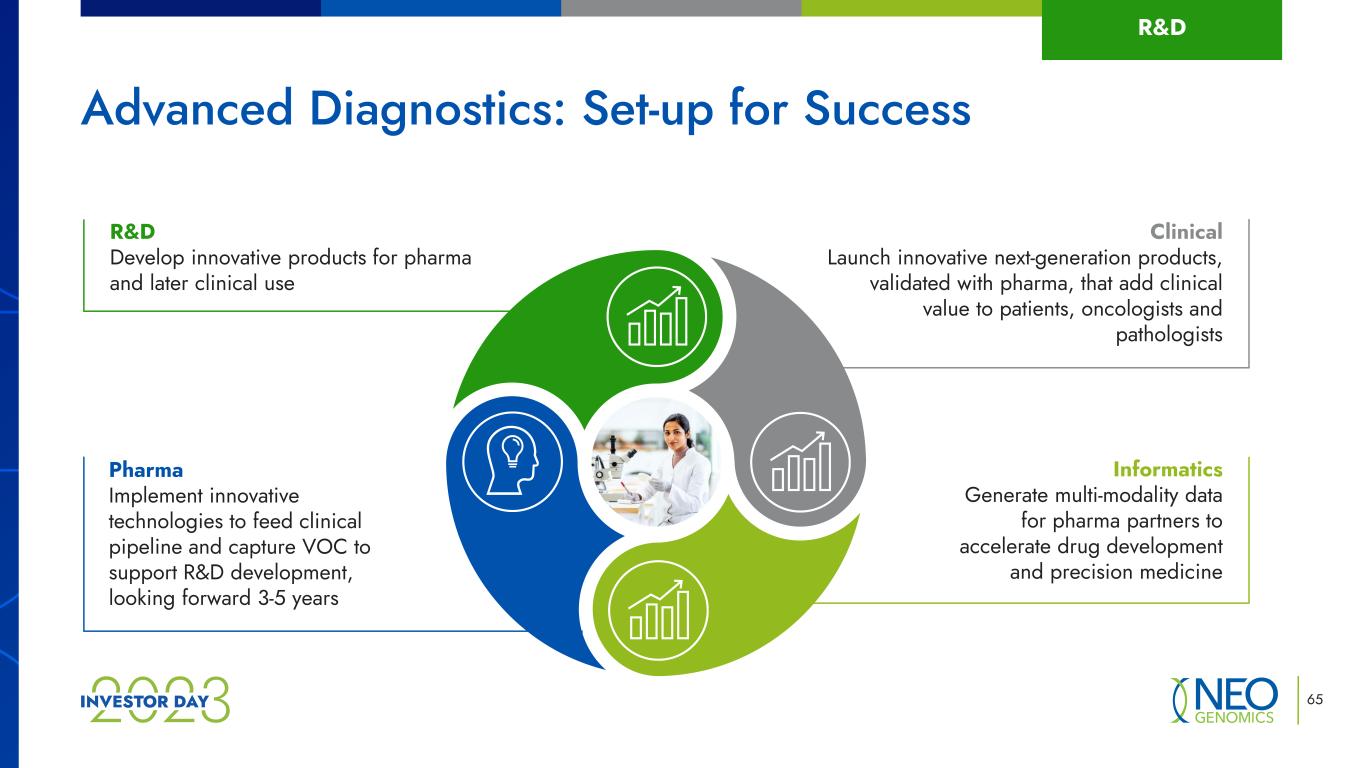
R&D Develop innovative products for pharma and later clinical use Clinical Launch innovative next-generation products, validated with pharma, that add clinical value to patients, oncologists and pathologists Pharma Implement innovative technologies to feed clinical pipeline and capture VOC to support R&D development, looking forward 3-5 years Informatics Generate multi-modality data for pharma partners to accelerate drug development and precision medicine 65 Advanced Diagnostics: Set-up for Success R&D
New Neo Comprehensive and RaDaR launches are helping grow revenue and market share and are rapidly expanding Neo’s informatics portfolio 66 Key Takeaways Pharma services changes implemented in 2022 are showing improved profitability 1 2 3 RaDaR is a key differentiator for Neo, allowing for longer-term revenue growth4 At Neo, we are driving to be an innovative R&D company and investing in next generation products that will help cancer patients for years to come

Long-Term Financial Outlook Jeff Sherman Chief Financial Officer
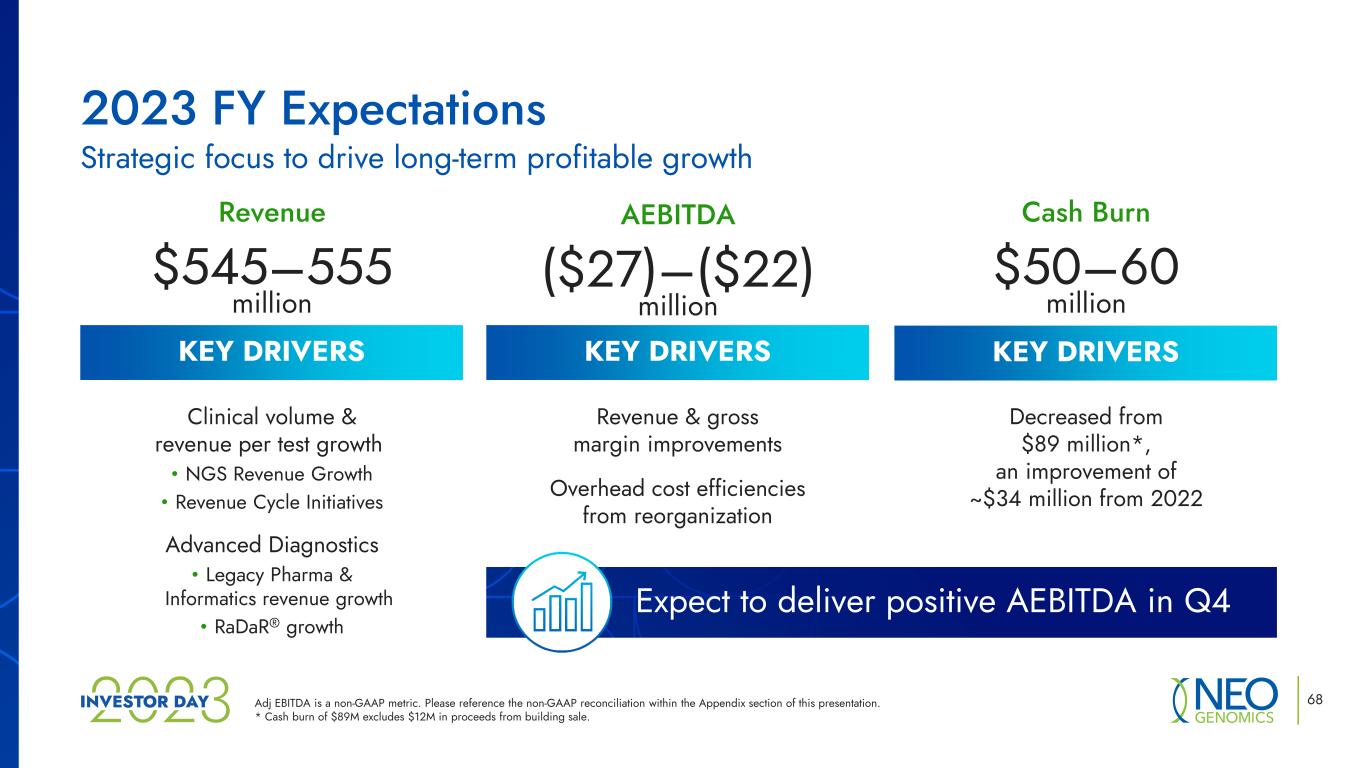
KEY DRIVERS 68 Revenue $545–555 million AEBITDA ($27)–($22) million Cash Burn $50–60 million Clinical volume & revenue per test growth • NGS Revenue Growth • Revenue Cycle Initiatives Advanced Diagnostics • Legacy Pharma & Informatics revenue growth • RaDaR® growth Revenue & gross margin improvements Overhead cost efficiencies from reorganization Decreased from $89 million*, an improvement of ~$34 million from 2022 Expect to deliver positive AEBITDA in Q4 2023 FY Expectations Strategic focus to drive long-term profitable growth Adj EBITDA is a non-GAAP metric. Please reference the non-GAAP reconciliation within the Appendix section of this presentation. * Cash burn of $89M excludes $12M in proceeds from building sale. KEY DRIVERS KEY DRIVERS
• Sales force expansion • Lab optimization and automation • Houston expansion • Long-term capacity planning • Workforce investments • RaDaR CMS/MolDx approval and clinical trials • R&D & innovation • Technology investments Investments Cost savings included in 2023 guidance. 69 • $25MM in annualized cost savings from Q1 2023 reorganization • Reduced G&A costs • Geographic footprint rationalization • Revenue cycle initiatives • Continued productivity across organization to offset headwinds and deliver margin expansion Operating Efficiencies Operating Efficiencies & Investments 2023
70 • Clinical Service Revenue • Clinical Volumes • Revenue per test • Advanced Diagnostics Revenue • Includes the following not broken out separately: • Pharma Revenue (stopped reporting bookings in Q3 2022) • Informatics Revenue • RaDaR Revenue • Adjusted Gross Margin • Adjusted EBITDA Margin • Capital Investments – cash burn/cash generation Reported Operating Metrics
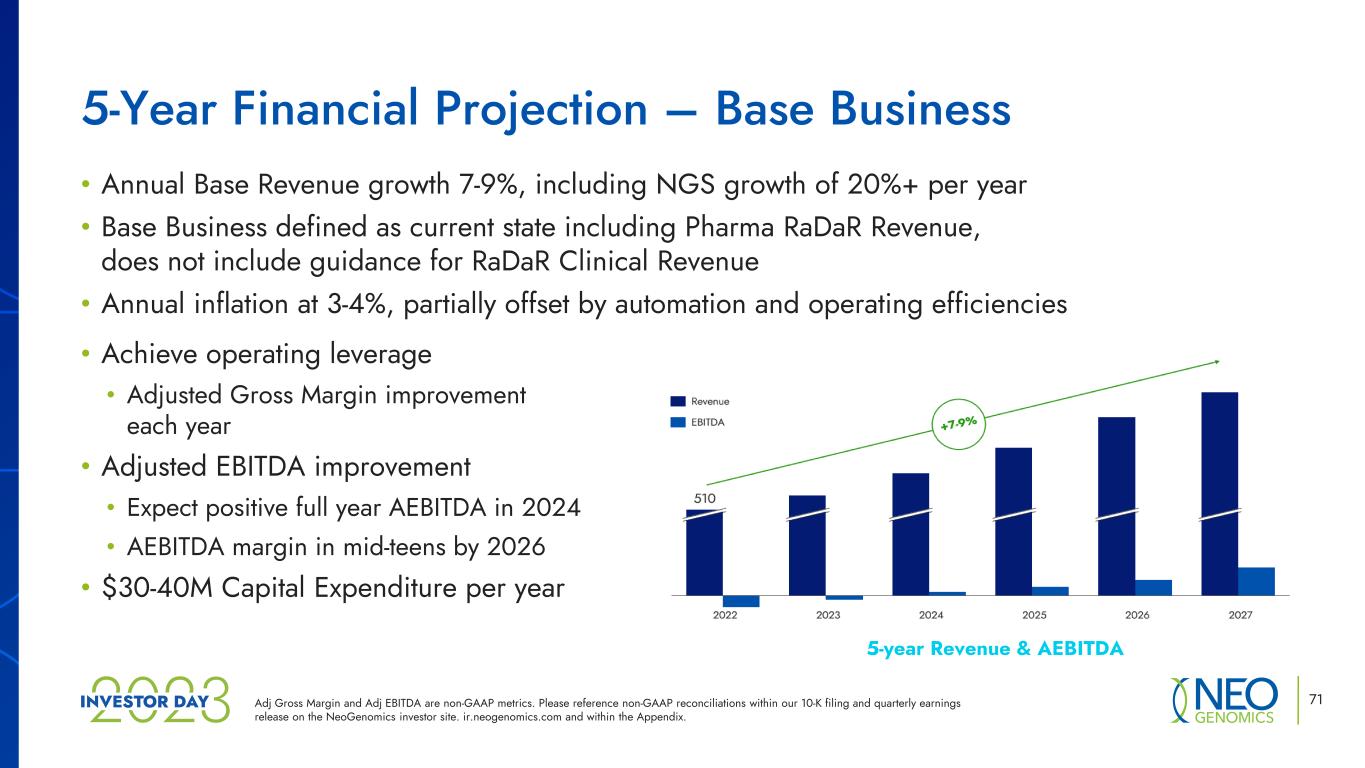
5-year Revenue & AEBITDA 71 • Annual Base Revenue growth 7-9%, including NGS growth of 20%+ per year • Base Business defined as current state including Pharma RaDaR Revenue, does not include guidance for RaDaR Clinical Revenue • Annual inflation at 3-4%, partially offset by automation and operating efficiencies • Achieve operating leverage • Adjusted Gross Margin improvement each year • Adjusted EBITDA improvement • Expect positive full year AEBITDA in 2024 • AEBITDA margin in mid-teens by 2026 • $30-40M Capital Expenditure per year 5-Year Financial Projection – Base Business Adj Gross Margin and Adj EBITDA are non-GAAP metrics. Please reference non-GAAP reconciliations within our 10-K filing and quarterly earnings release on the NeoGenomics investor site. ir.neogenomics.com and within the Appendix.
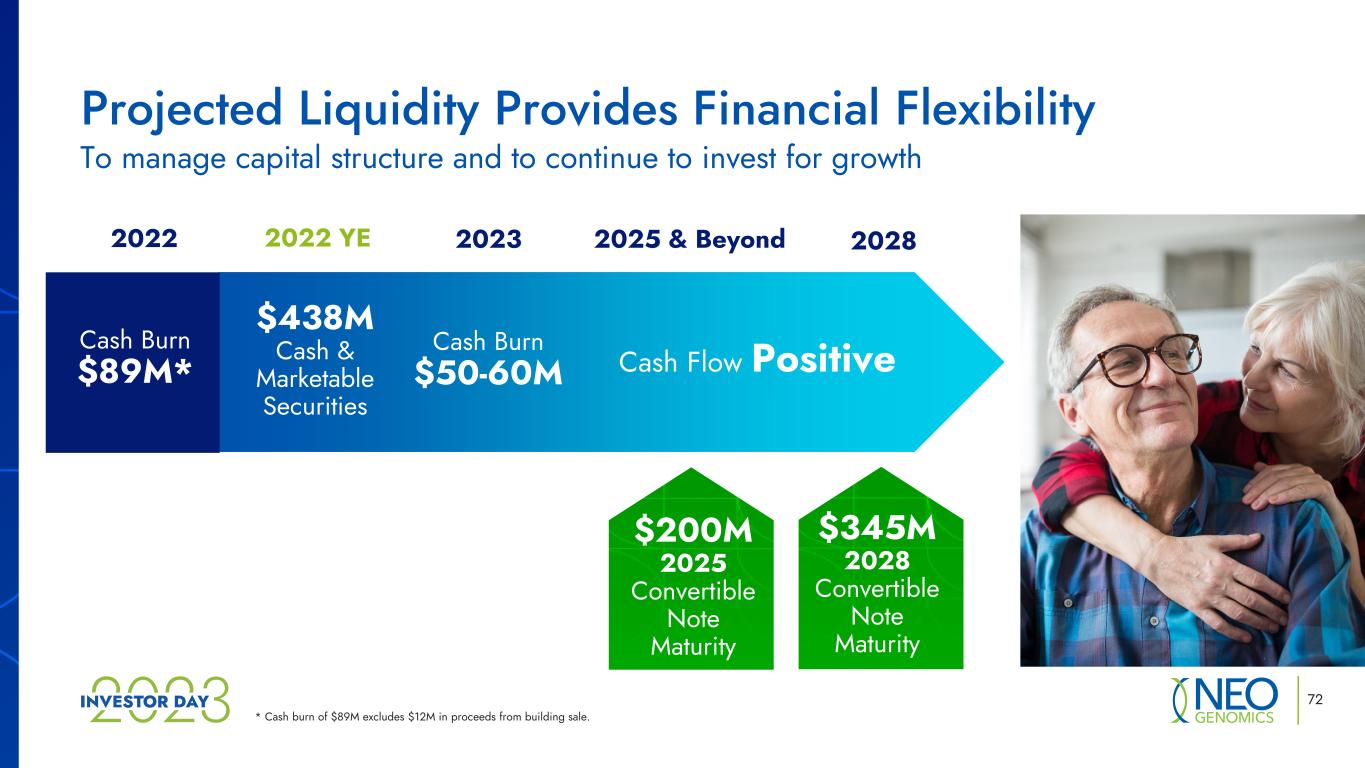
Cash Burn $50-60M Cash Flow Positive 72 $438M Cash & Marketable Securities 2022 2023 2025 & Beyond $200M 2025 Convertible Note Maturity 2022 YE Cash Burn $89M* Projected Liquidity Provides Financial Flexibility To manage capital structure and to continue to invest for growth * Cash burn of $89M excludes $12M in proceeds from building sale. 2028 $345M 2028 Convertible Note Maturity
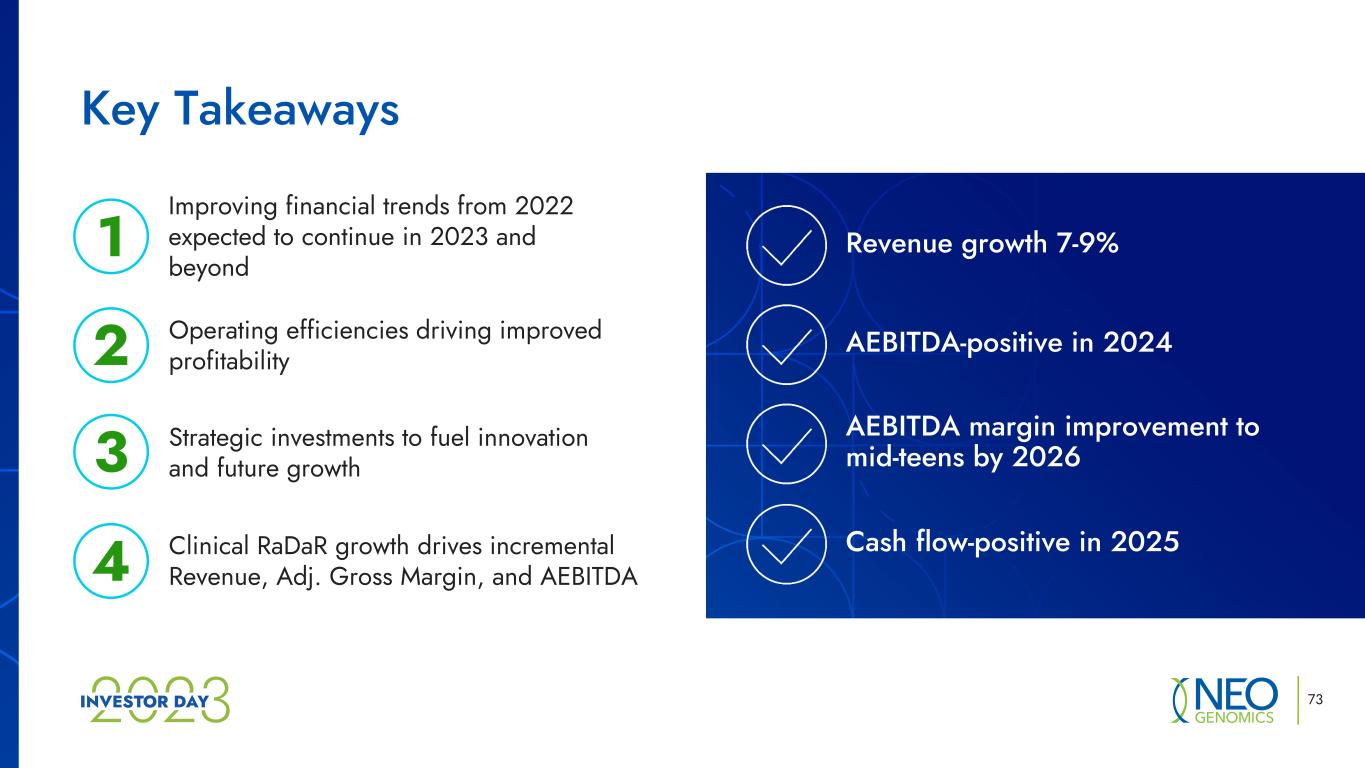
73 Key Takeaways Strategic investments to fuel innovation and future growth Operating efficiencies driving improved profitability Improving financial trends from 2022 expected to continue in 2023 and beyond 1 2 3 Clinical RaDaR growth drives incremental Revenue, Adj. Gross Margin, and AEBITDA4 Revenue growth 7-9% AEBITDA-positive in 2024 AEBITDA margin improvement to mid-teens by 2026 Cash flow-positive in 2025
Appendix 74
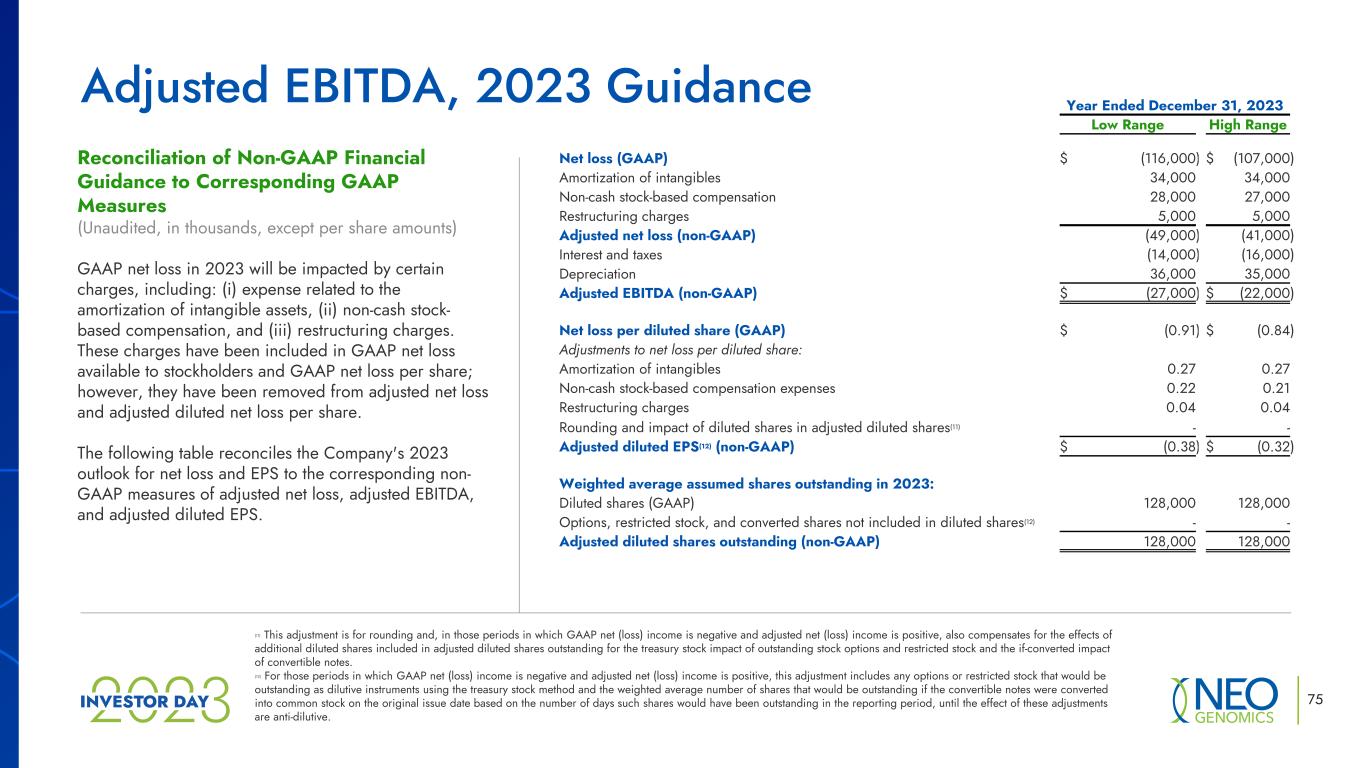
Year Ended December 31, 2023 Low Range High Range Net loss (GAAP) $ (116,000) $ (107,000) Amortization of intangibles 34,000 34,000 Non-cash stock-based compensation 28,000 27,000 Restructuring charges 5,000 5,000 Adjusted net loss (non-GAAP) (49,000) (41,000) Interest and taxes (14,000) (16,000) Depreciation 36,000 35,000 Adjusted EBITDA (non-GAAP) $ (27,000) $ (22,000) Net loss per diluted share (GAAP) $ (0.91) $ (0.84) Adjustments to net loss per diluted share: Amortization of intangibles 0.27 0.27 Non-cash stock-based compensation expenses 0.22 0.21 Restructuring charges 0.04 0.04 Rounding and impact of diluted shares in adjusted diluted shares(11) - - Adjusted diluted EPS(12) (non-GAAP) $ (0.38) $ (0.32) Weighted average assumed shares outstanding in 2023: Diluted shares (GAAP) 128,000 128,000 Options, restricted stock, and converted shares not included in diluted shares(12) - - Adjusted diluted shares outstanding (non-GAAP) 128,000 128,000 Reconciliation of Non-GAAP Financial Guidance to Corresponding GAAP Measures (Unaudited, in thousands, except per share amounts) GAAP net loss in 2023 will be impacted by certain charges, including: (i) expense related to the amortization of intangible assets, (ii) non-cash stock- based compensation, and (iii) restructuring charges. These charges have been included in GAAP net loss available to stockholders and GAAP net loss per share; however, they have been removed from adjusted net loss and adjusted diluted net loss per share. The following table reconciles the Company's 2023 outlook for net loss and EPS to the corresponding non- GAAP measures of adjusted net loss, adjusted EBITDA, and adjusted diluted EPS. (11) This adjustment is for rounding and, in those periods in which GAAP net (loss) income is negative and adjusted net (loss) income is positive, also compensates for the effects of additional diluted shares included in adjusted diluted shares outstanding for the treasury stock impact of outstanding stock options and restricted stock and the if-converted impact of convertible notes. (12) For those periods in which GAAP net (loss) income is negative and adjusted net (loss) income is positive, this adjustment includes any options or restricted stock that would be outstanding as dilutive instruments using the treasury stock method and the weighted average number of shares that would be outstanding if the convertible notes were converted into common stock on the original issue date based on the number of days such shares would have been outstanding in the reporting period, until the effect of these adjustments are anti-dilutive. Adjusted EBITDA, 2023 Guidance 75
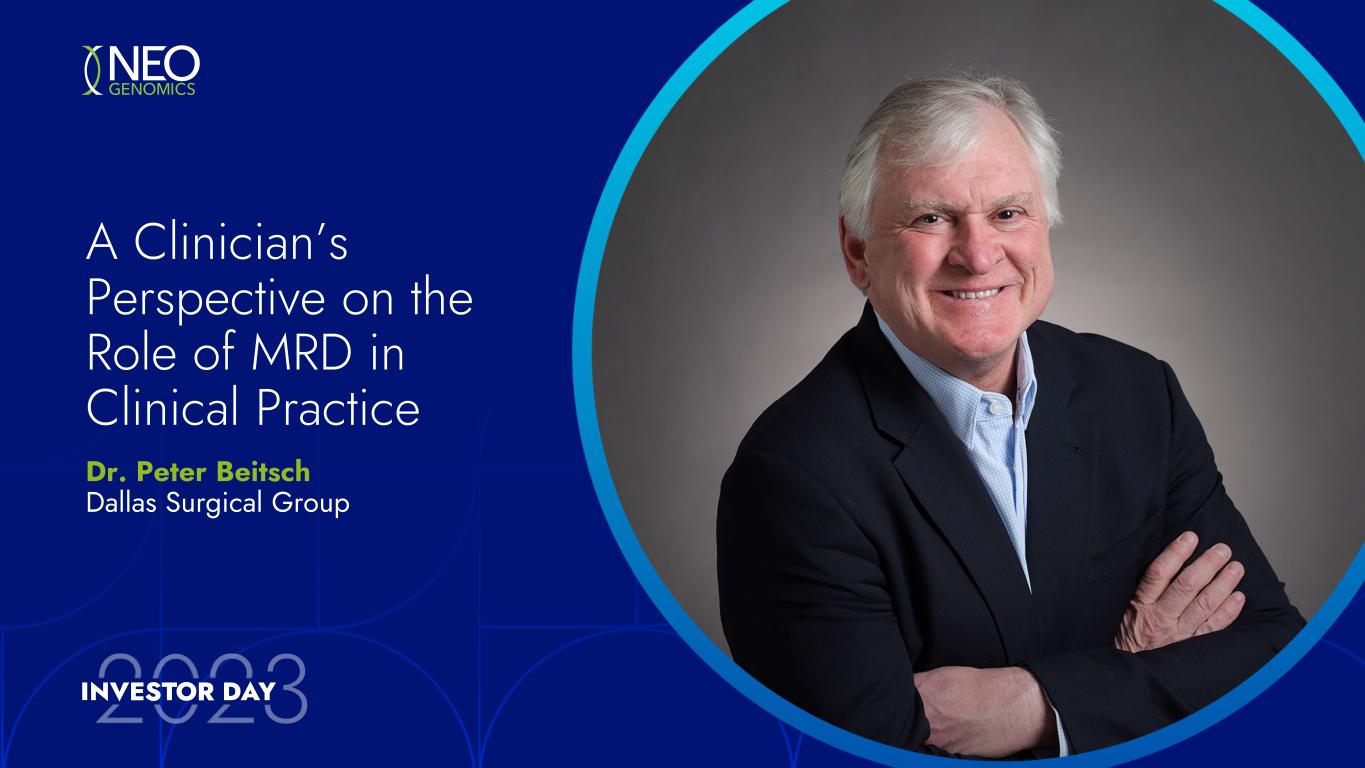
A Clinician’s Perspective on the Role of MRD in Clinical Practice Dr. Peter Beitsch Dallas Surgical Group

Q & A 78
